The primary feedback that we received for Codebase Maps1 is to be able to visualize functions. This makes sense – when people think of code they are usually imagining a few key functions or areas in a sea of code. To be able to explain or grok something would require the ability to represent them visually.
The problem, or challenge shall I say, of giving shape to functions is the sheer number of them in any given codebase. A typical production Codebase contains hundreds if not thousands of files; the amount of functions in them are easily a magnitude larger, and the lines of code another magnitude or two more.
That’s what we set out to do. Of all the things we made at CodeSee, Function Maps resonated the most with users and customers. Getting there was not easy, and I’ll talk a bit about how we got there.
TL;DR
- The key challenge in representing functions or code is finding the right level of abstraction that helps with learning and understanding that does not overwhelm the user.
- Function calls are but one way to represent work done inside of codebases. To capture how people understand codebases, we built ways to bring related code snippets onto the map.
- Software is always done as a team. To complete the loop, function maps had to gain the ability to annotate and share the knowledge that is produced and captured.
Initial explorations
To begin, we had to understand what visualizing function means. We couldn’t take the naive approach. If we show functions indiscriminately, it would quickly overwhelm a user working with codebases of any modicum bit of complexity.
So what do we know? First of, we know how people use Codebase Maps and the strengths and weaknesses of using file structure to represent knowledge. Secondly, we can consult industry sources. The C4 model has a good breakdown of software diagraming, and says this of the code diagram level, “this level of detail is not recommended for anything but the most important or complex components”.
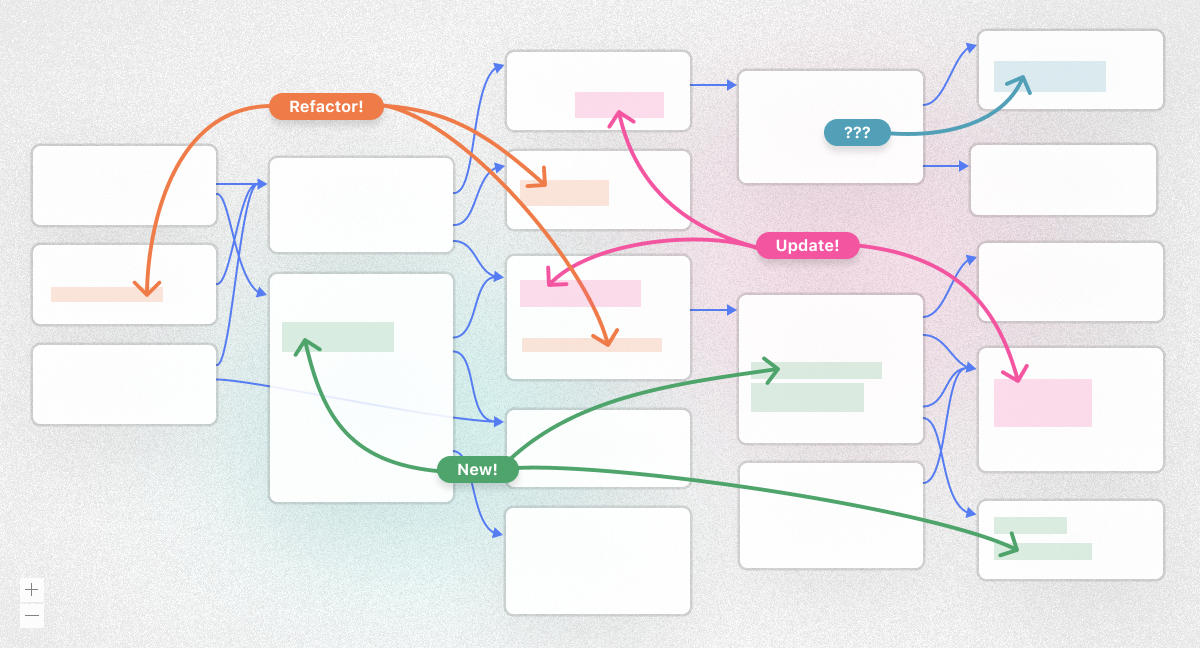
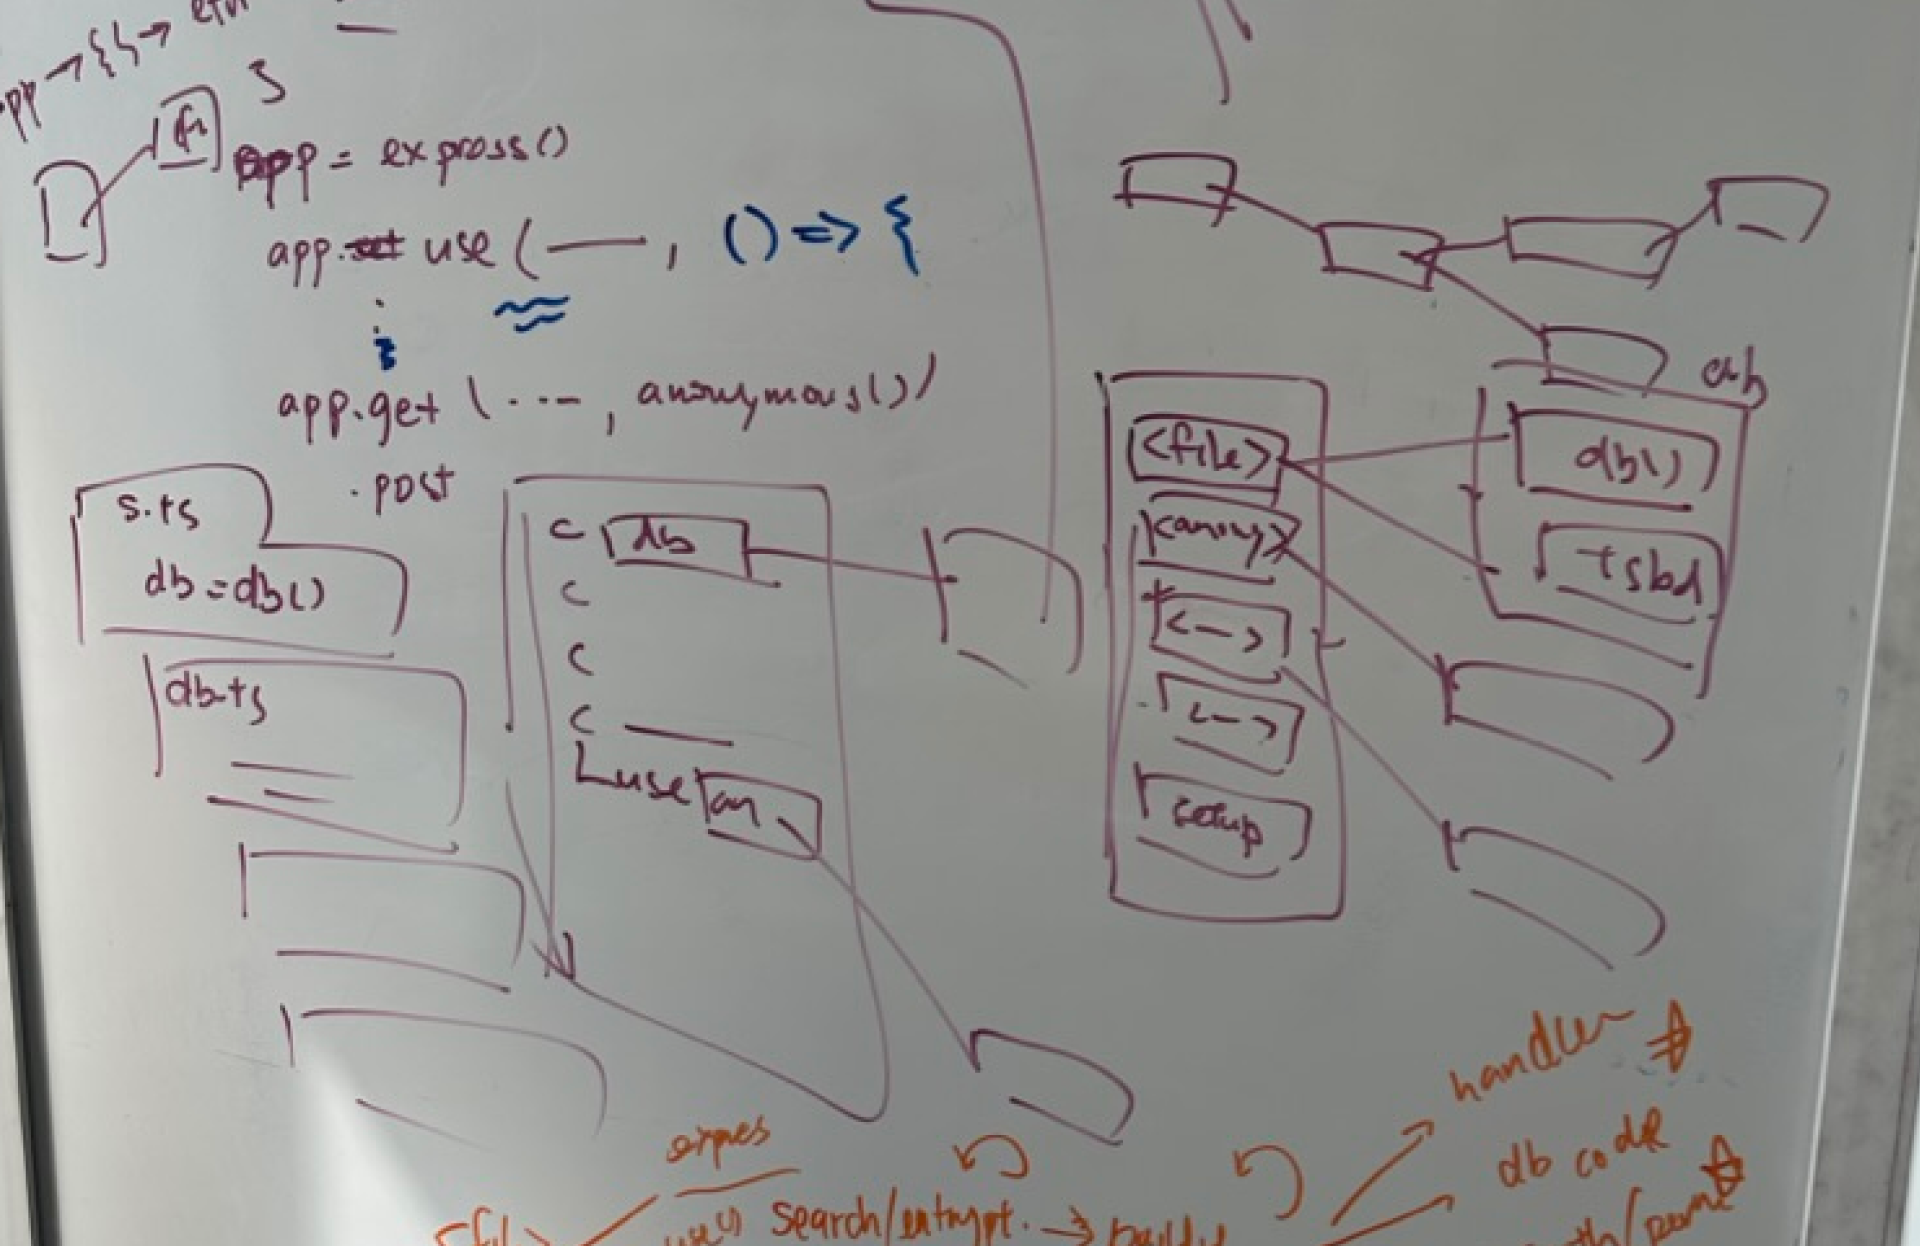
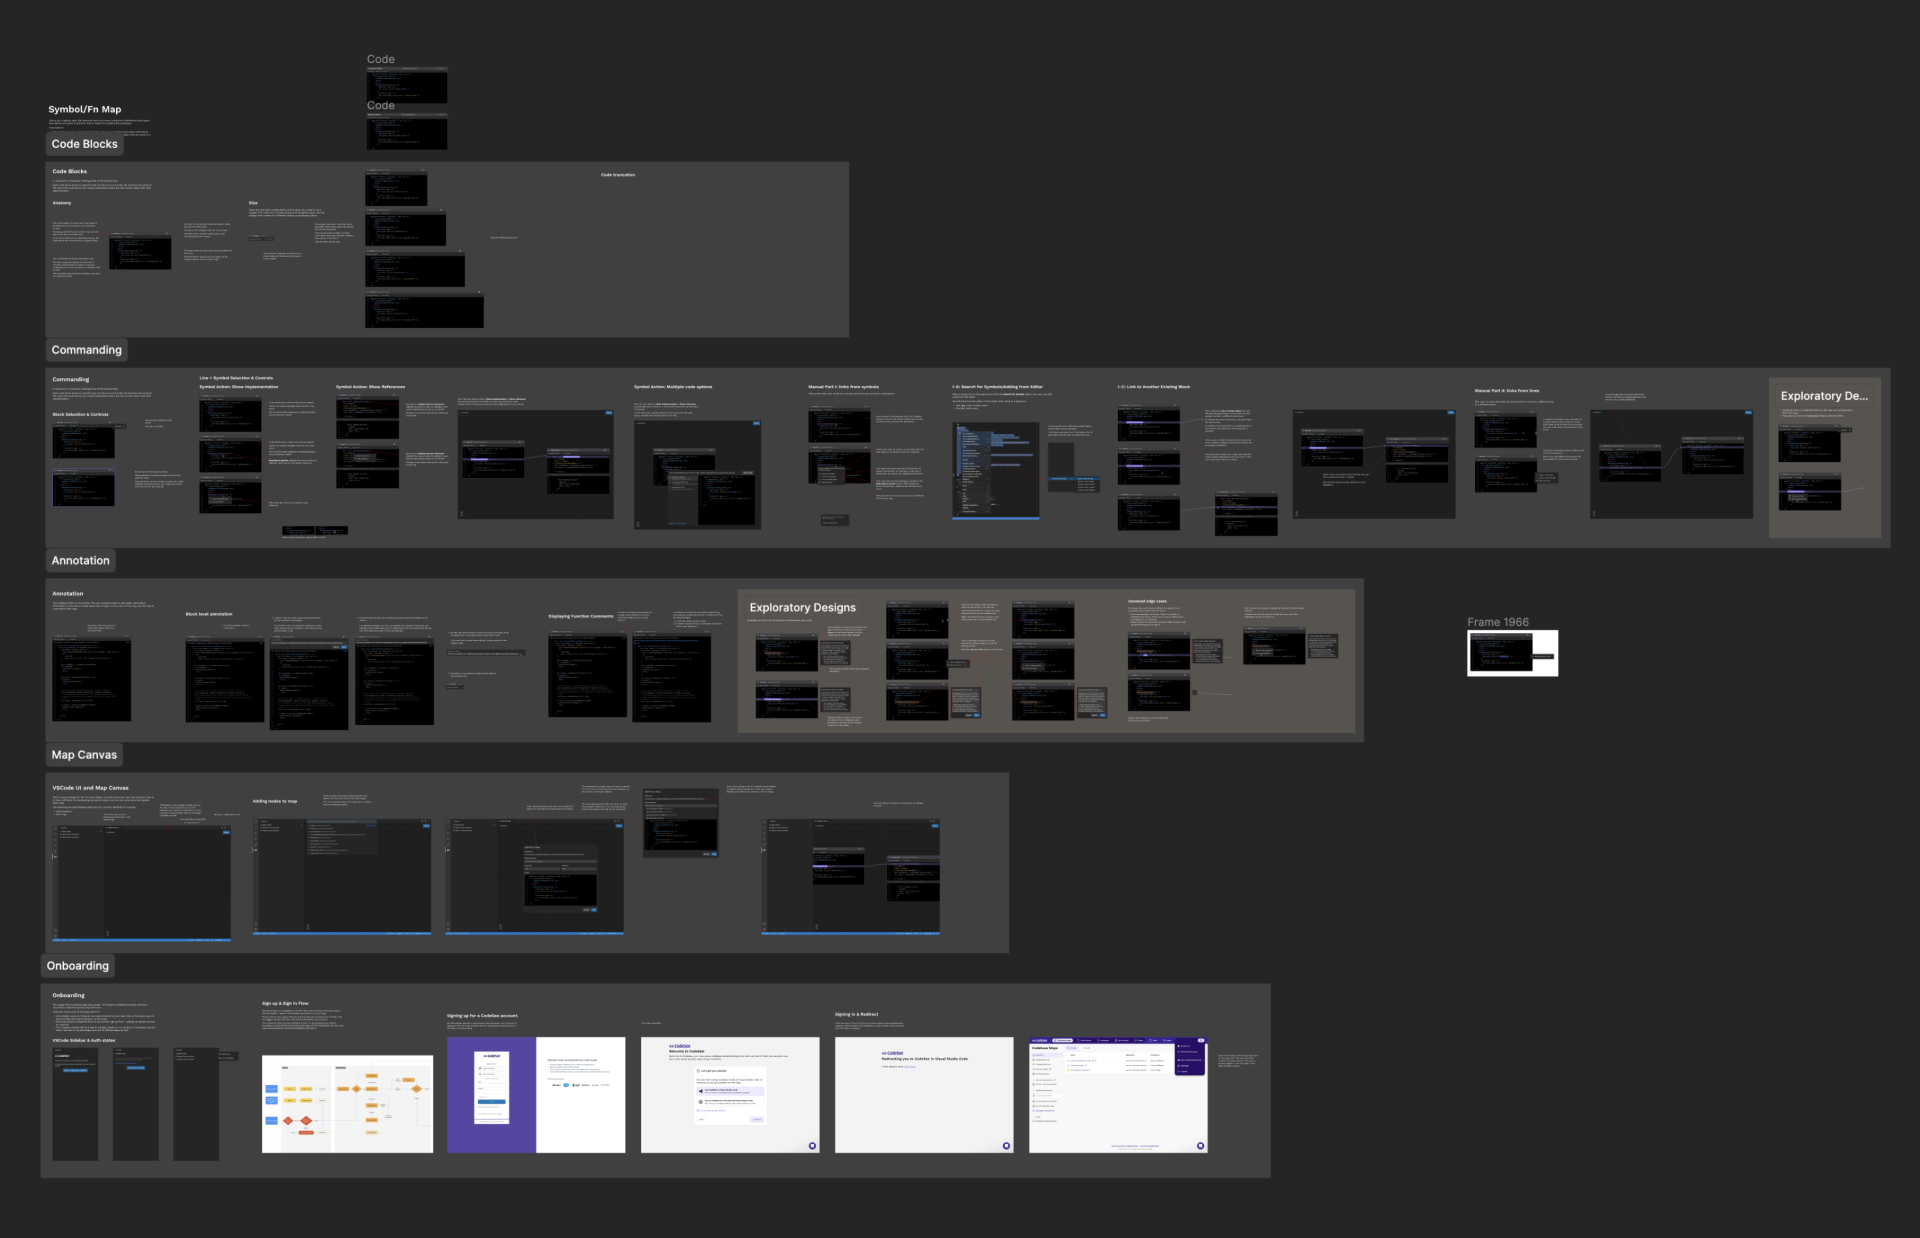
We also know that when people describe functions as a way of explaining or understanding codebases, they are thinking of the few important chunks of code – be it business logic or architectural cruxes – and discarding the bulk of other code that is written to route, support, or test them. With these in mind, I started building prototypes to explore “showing functions inside visualizations”.
With these sacrificial concepts in hand, Josh – one of the co-founder – and I came together to interrogate these prototypes. We talked about their strengths and weaknesses and tested them against our original goals and design constraints.After doing the synthesis, we settled on a few key design principles and built more prototypes.
Validation testing
From the candidate wireframe, we built a prototype demonstrating the key features of Function Maps and how it would work on a real codebase. We then show this to a few software engineers.
The feedback was positive! One participant noted that of all the new product ideas that he has evaluated, this would stood out the most. For software engineers like himself, they often struggle with sharing and explaining their work to other members of the team, especially when the code is gnarly and is difficult to glean from in a short code review. Having a tool that is able to strip out the noise and focus on the key paths can improve productivity for both the author and the reviewer.
The research helped us build an understanding of where this tool may fit within the engineering roles and team workflow to guide the design and development of the product. More importantly, there were a few immediate and tangible next steps to focus on.
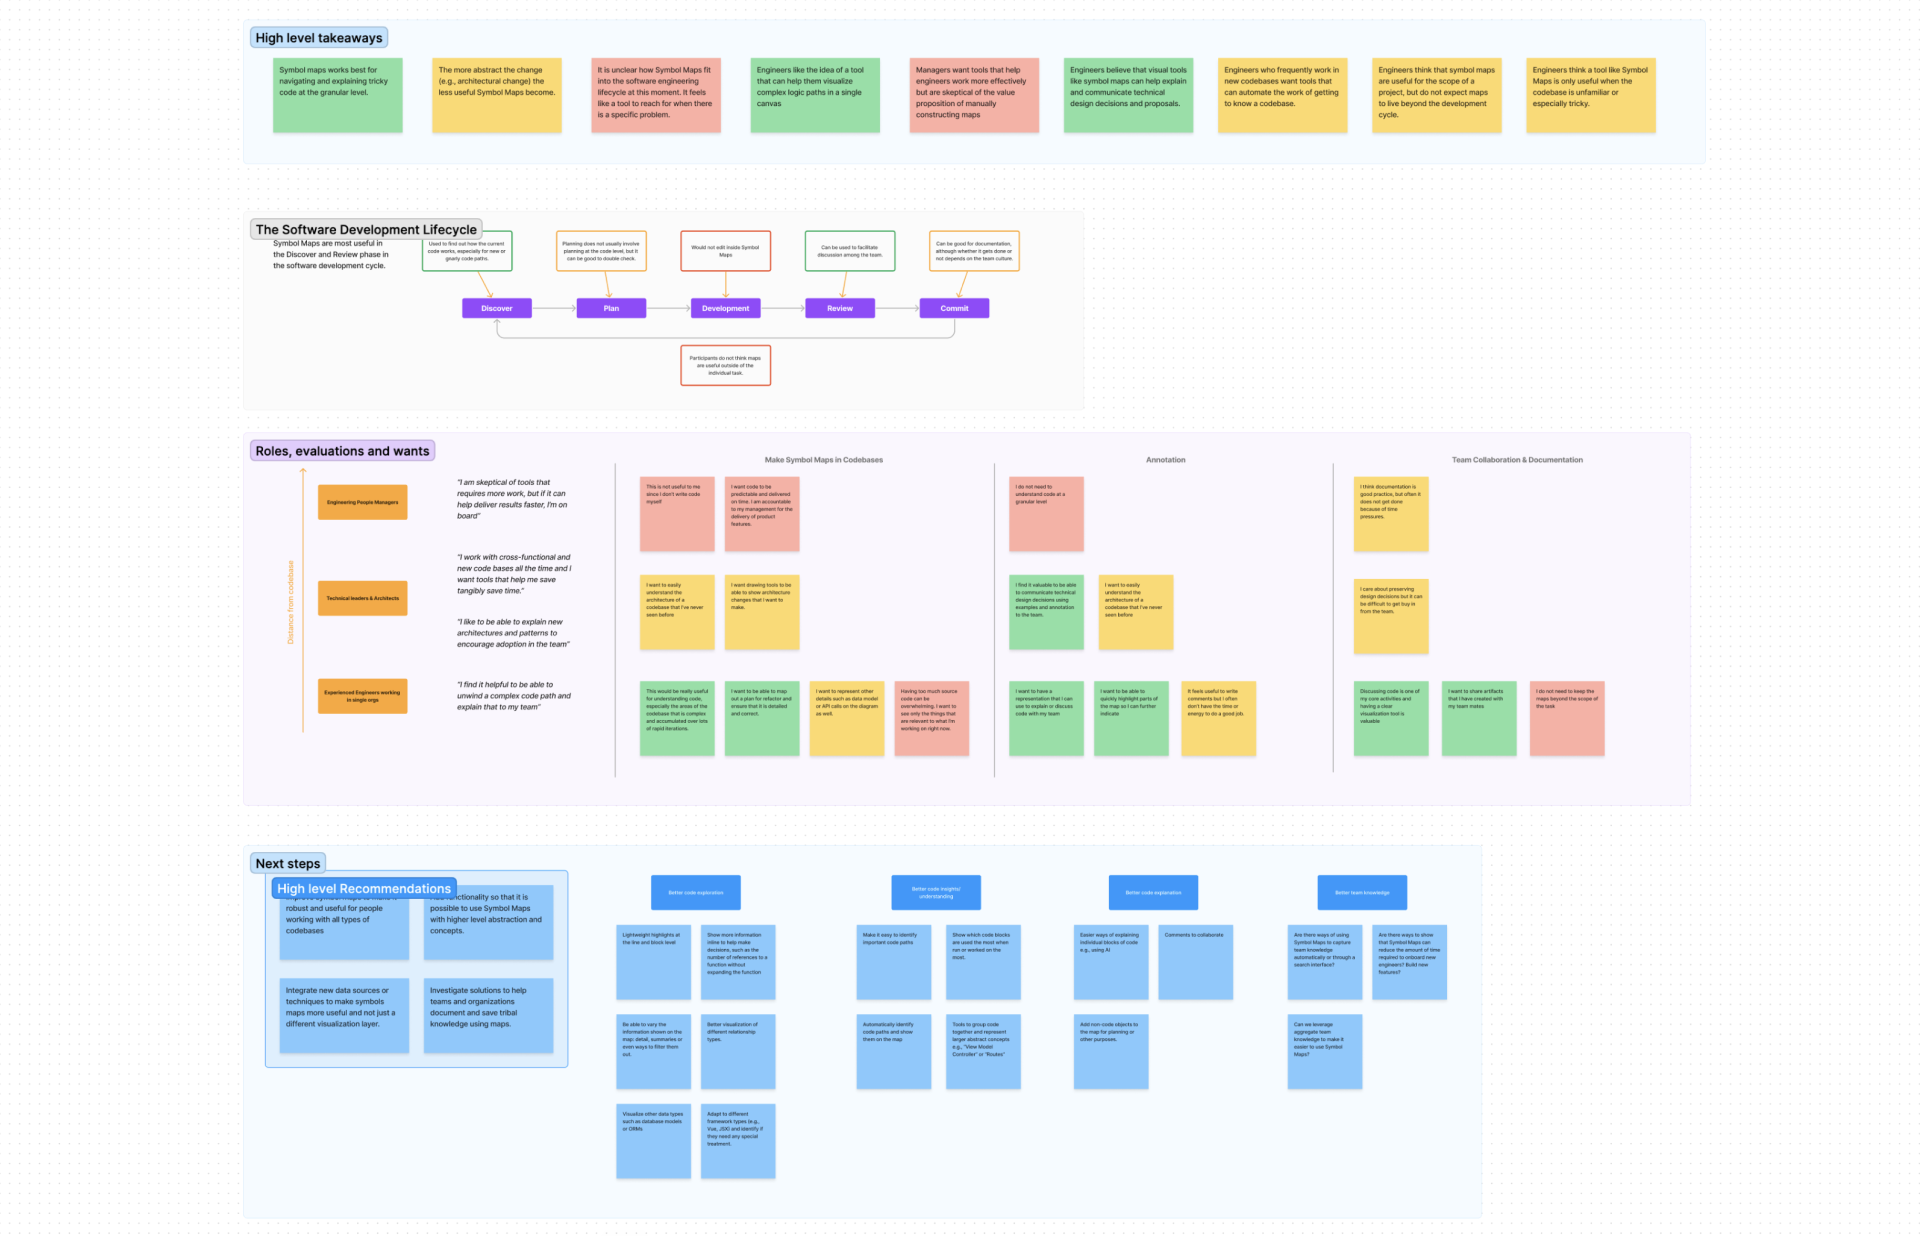
Research analysis with takeaways and analysis on where it fits in the user workflow, synthesized from user interviews.
Foundational designs
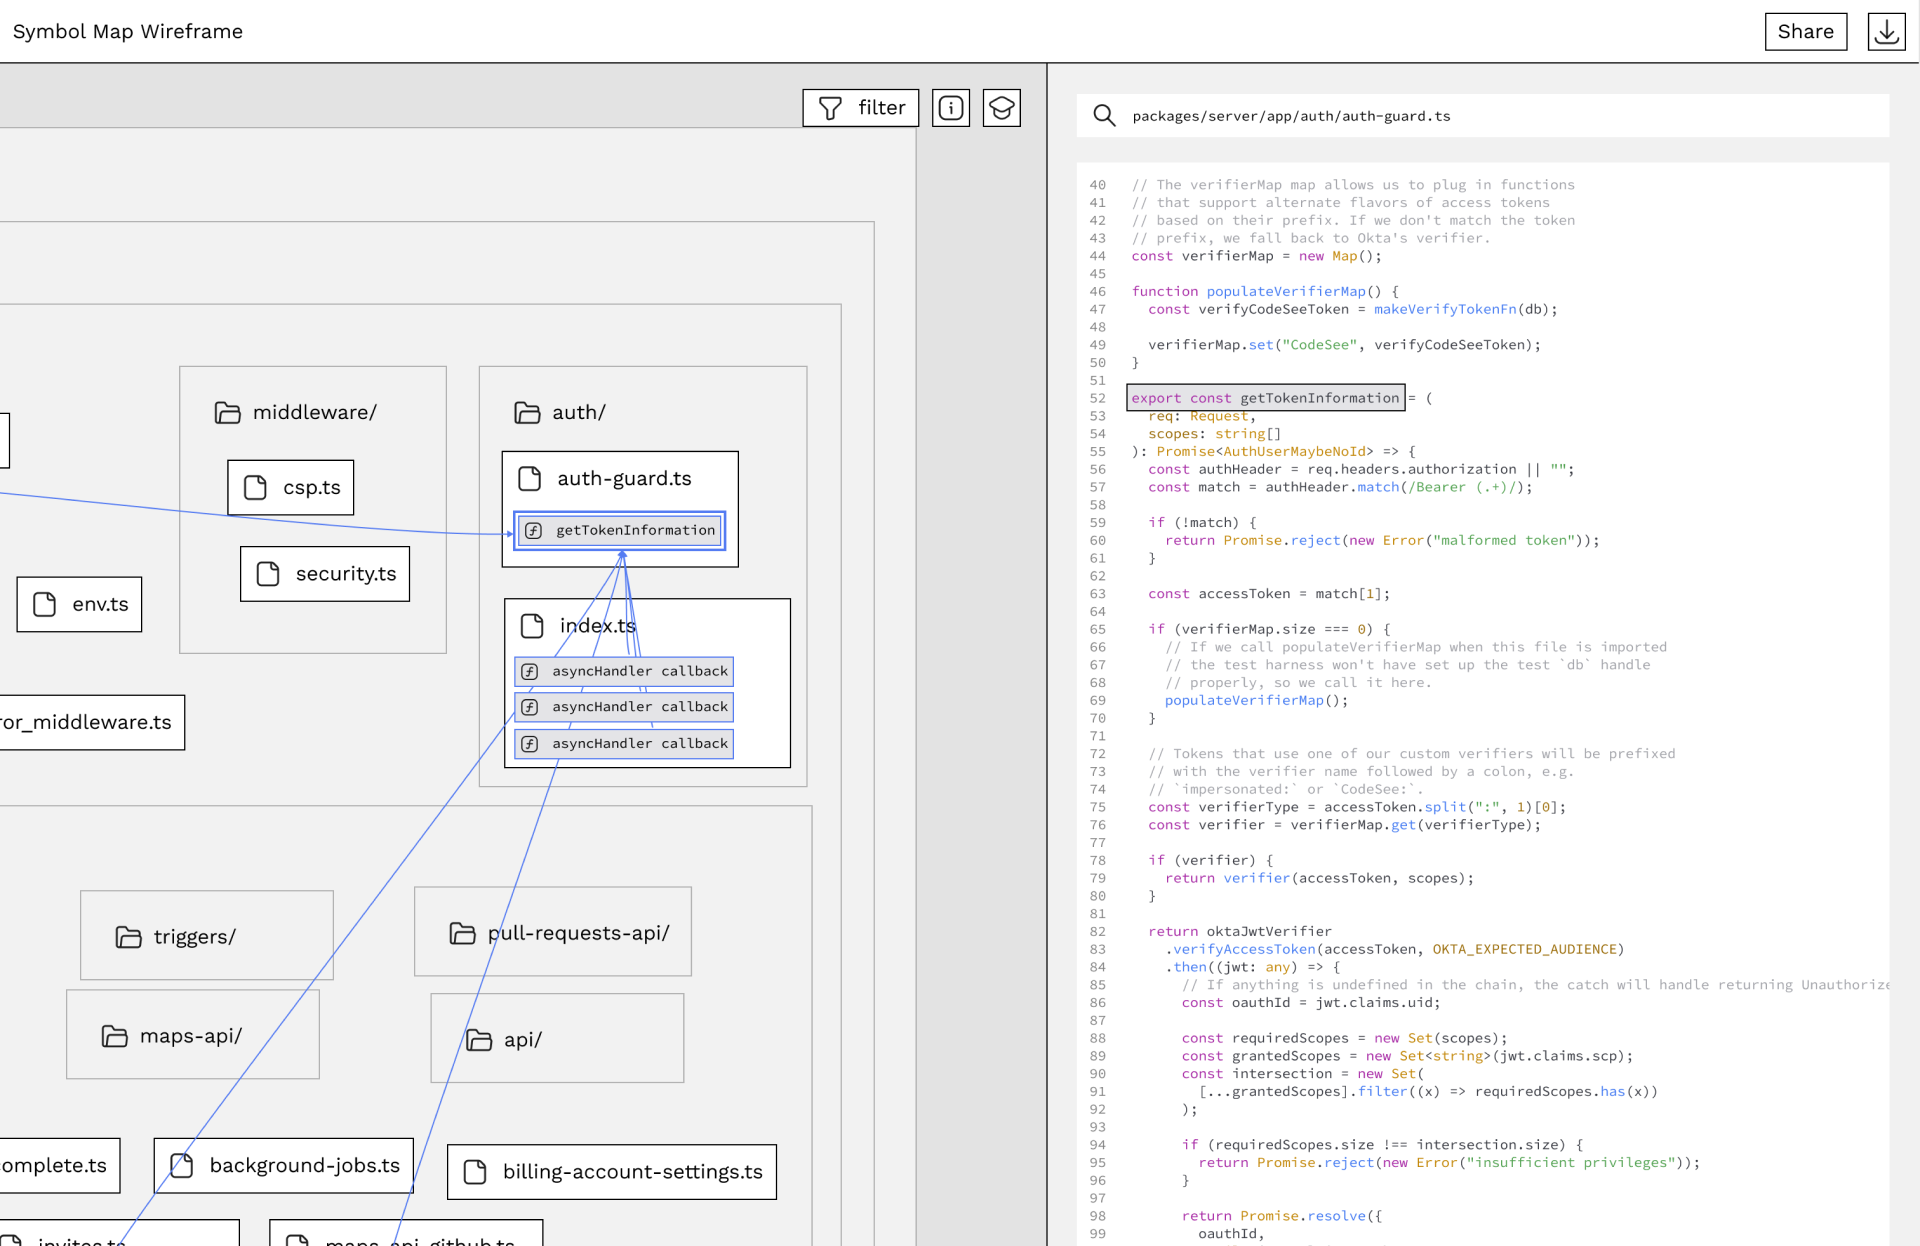
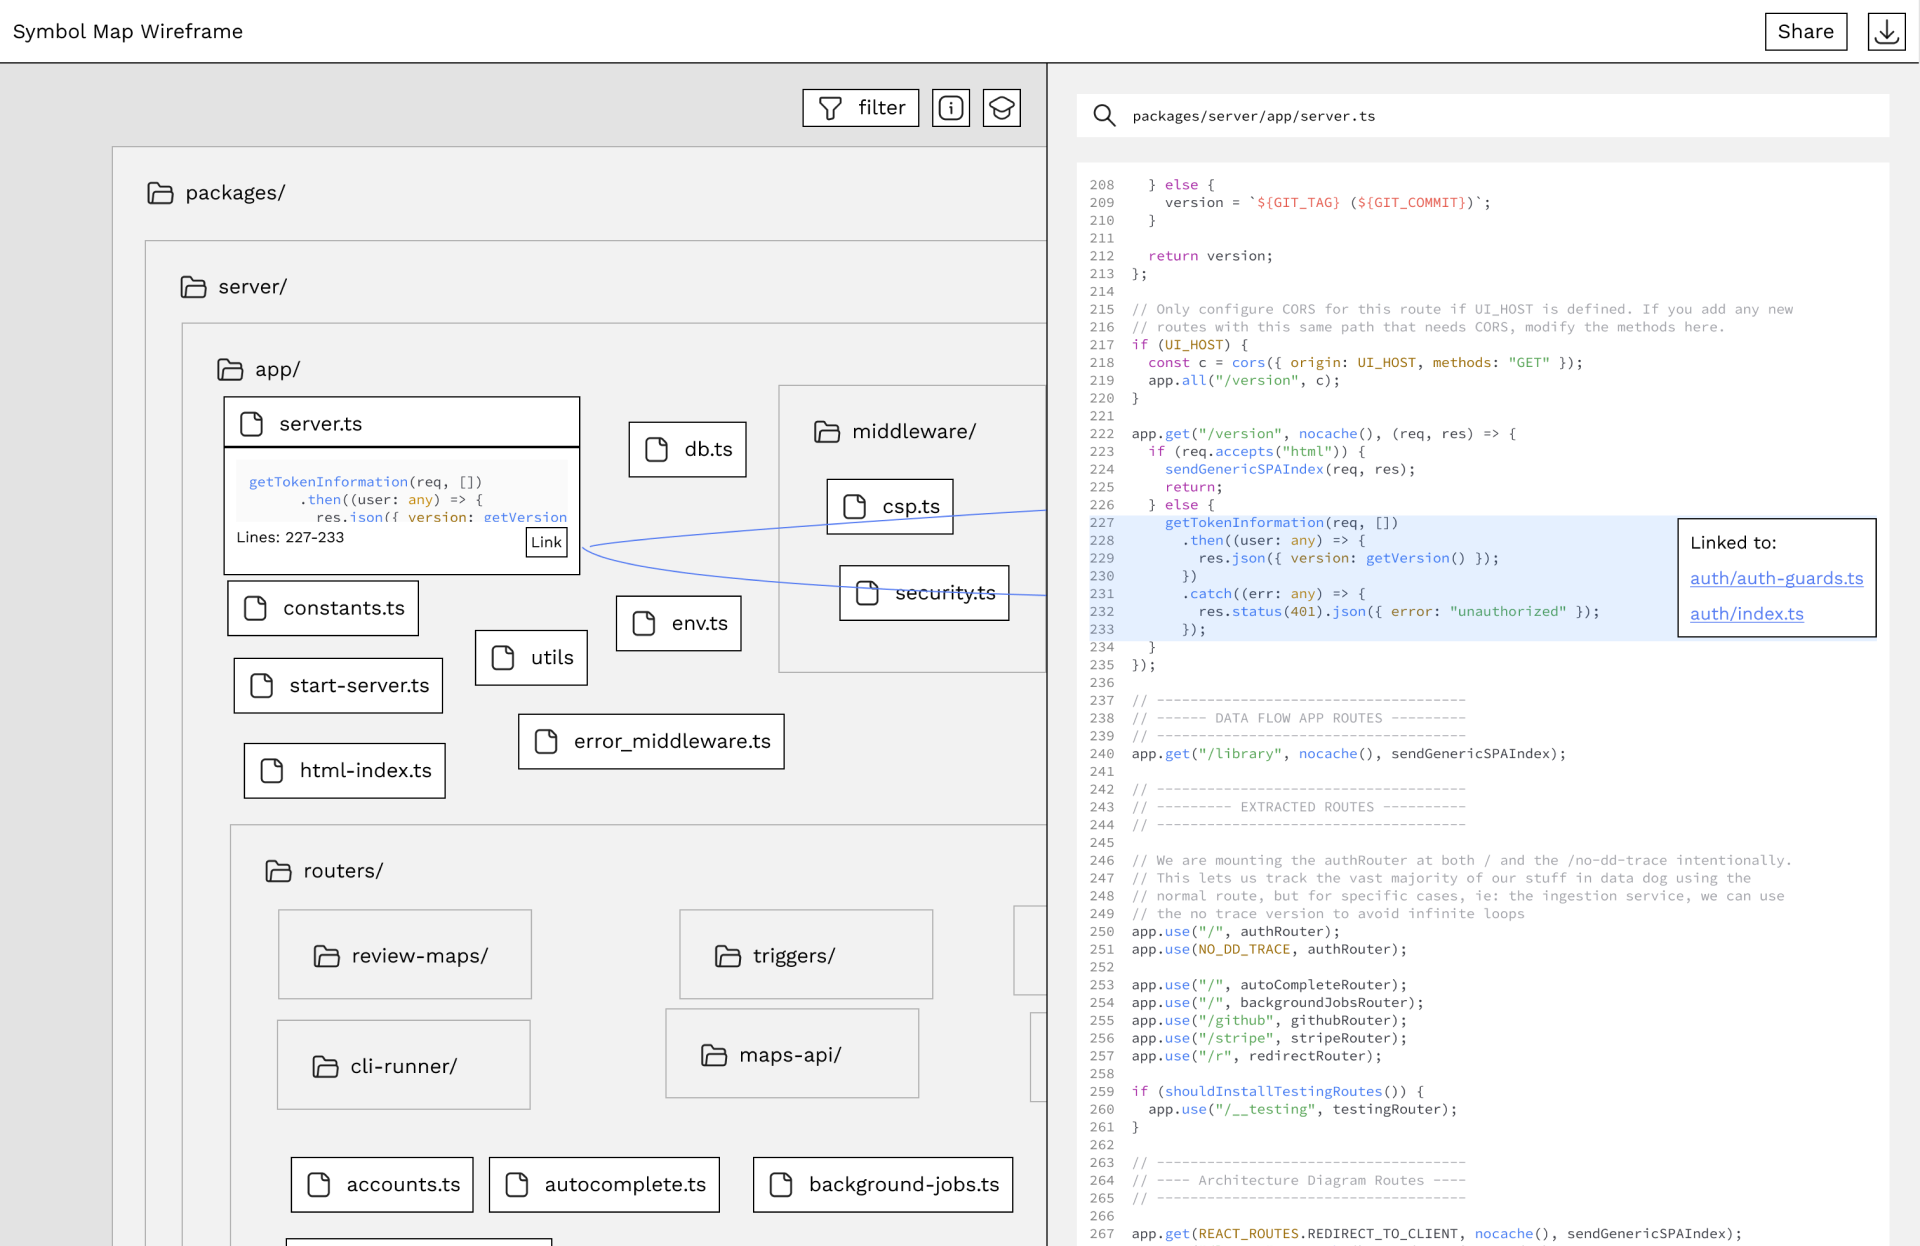
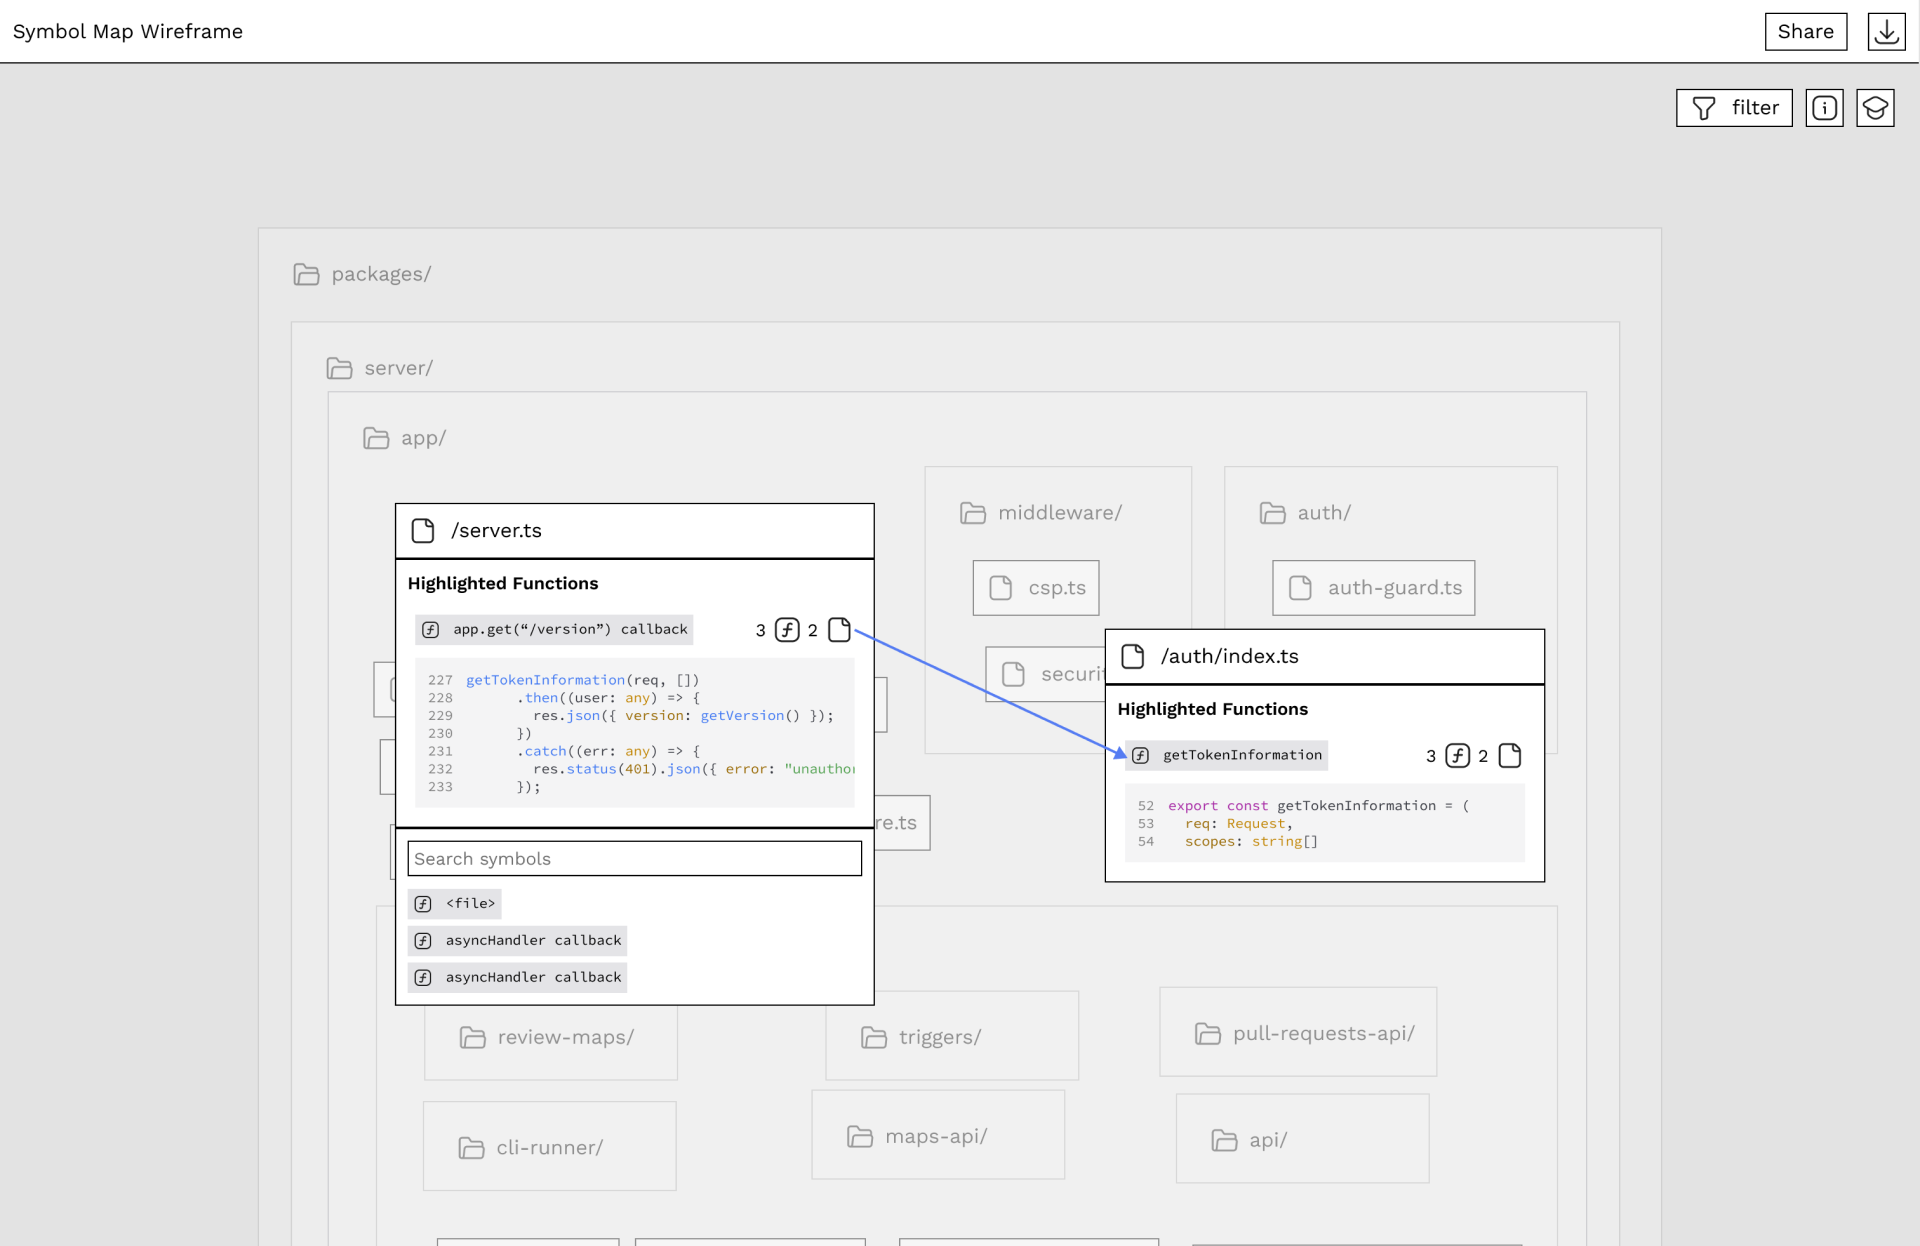
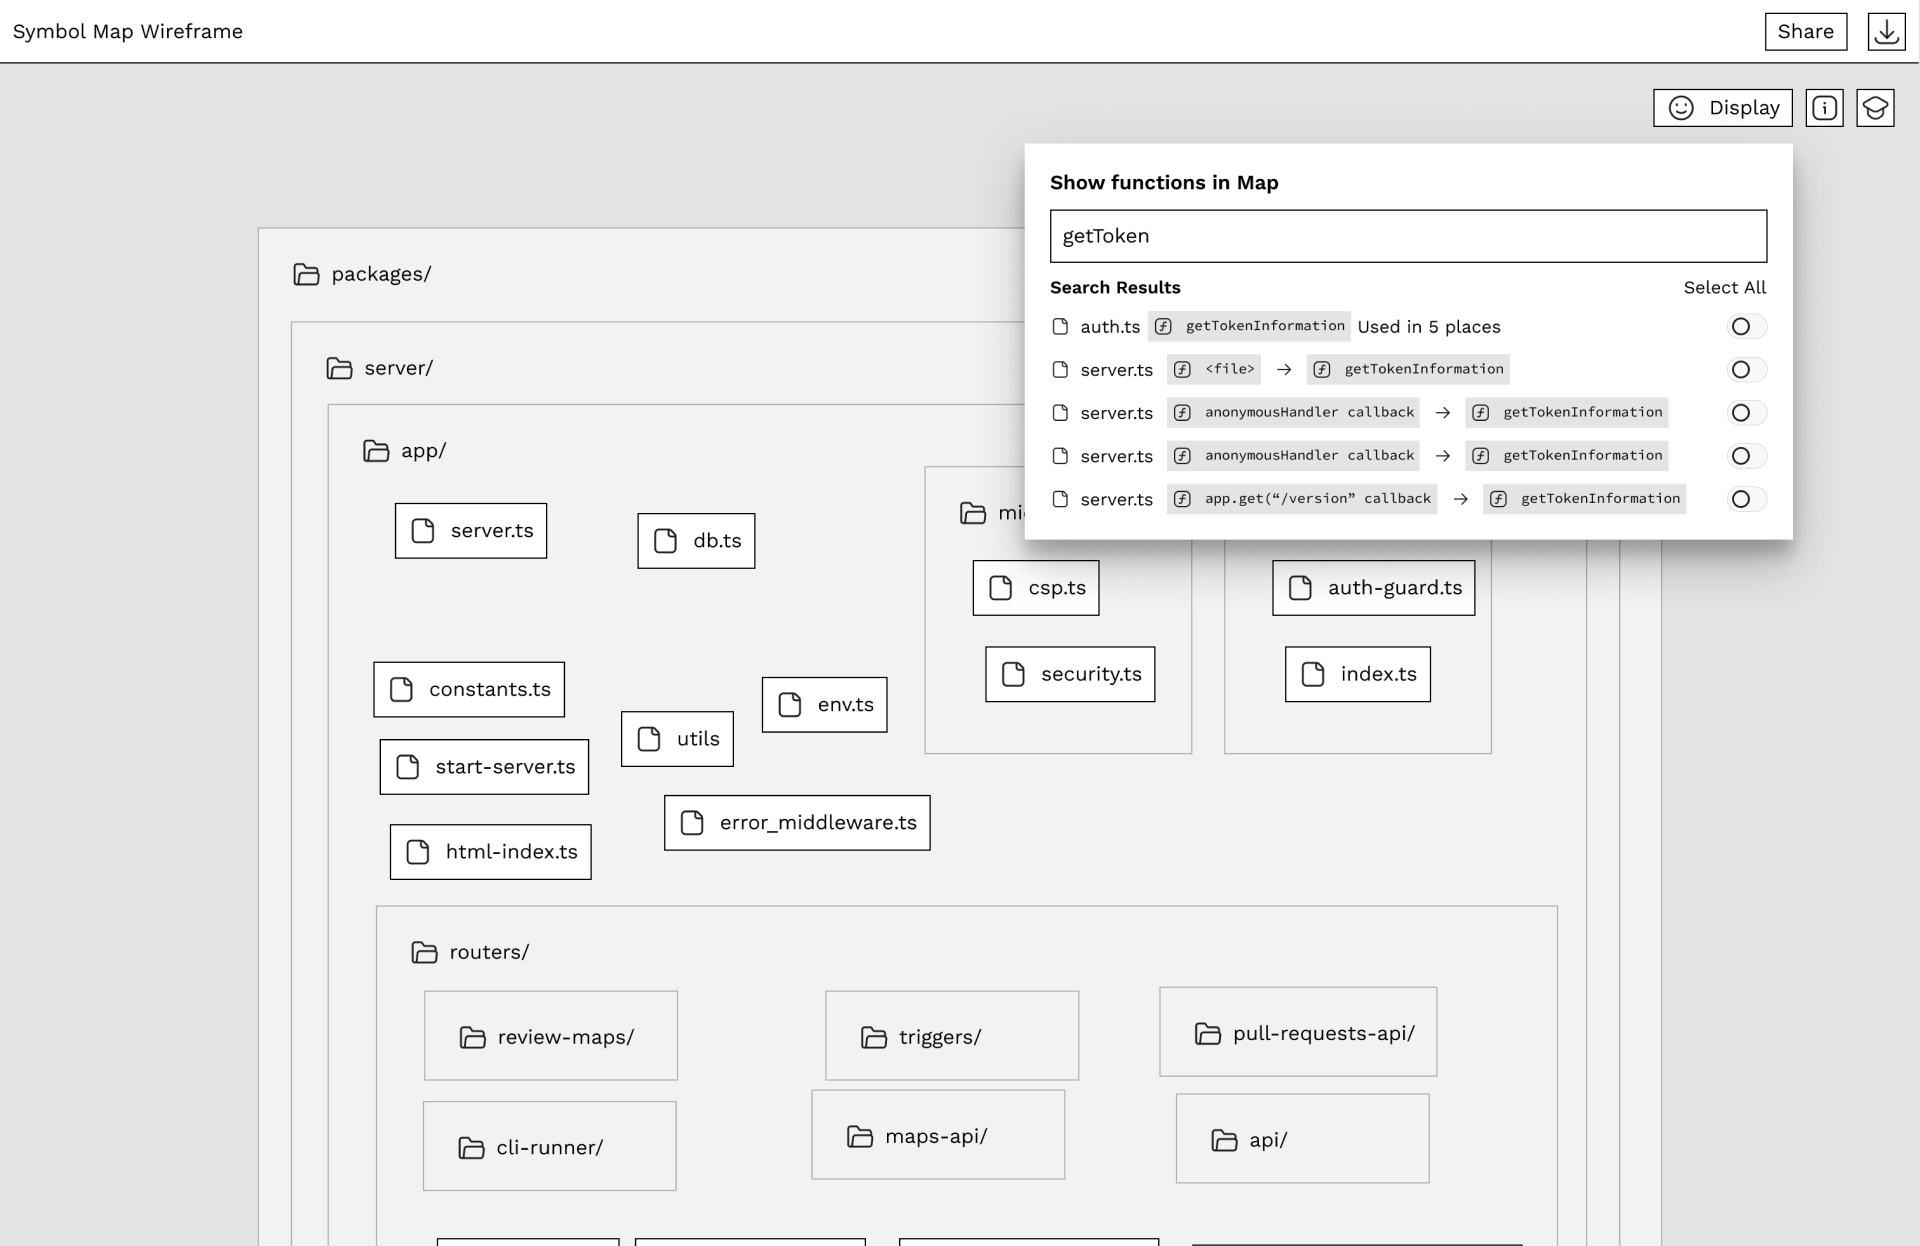
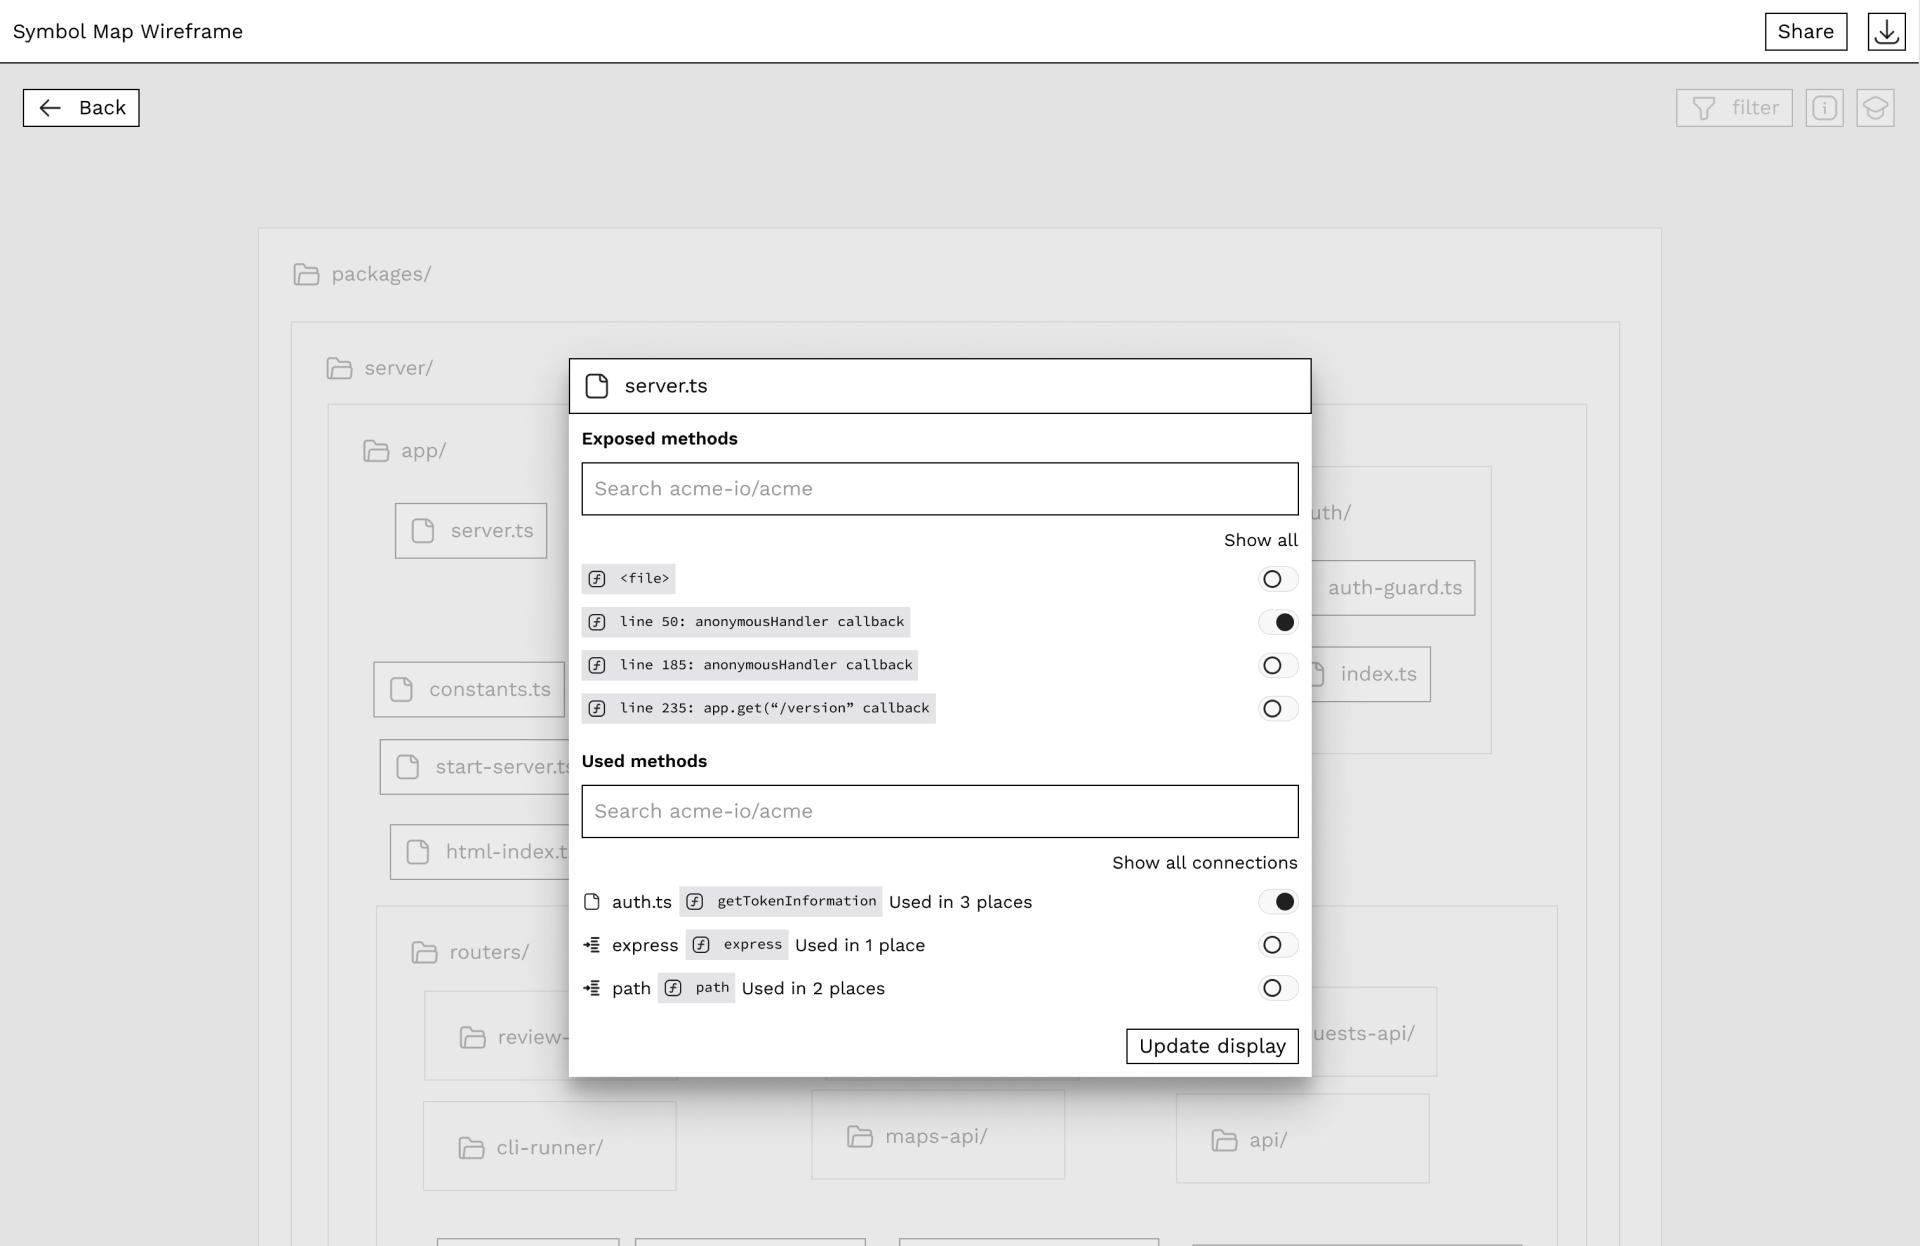
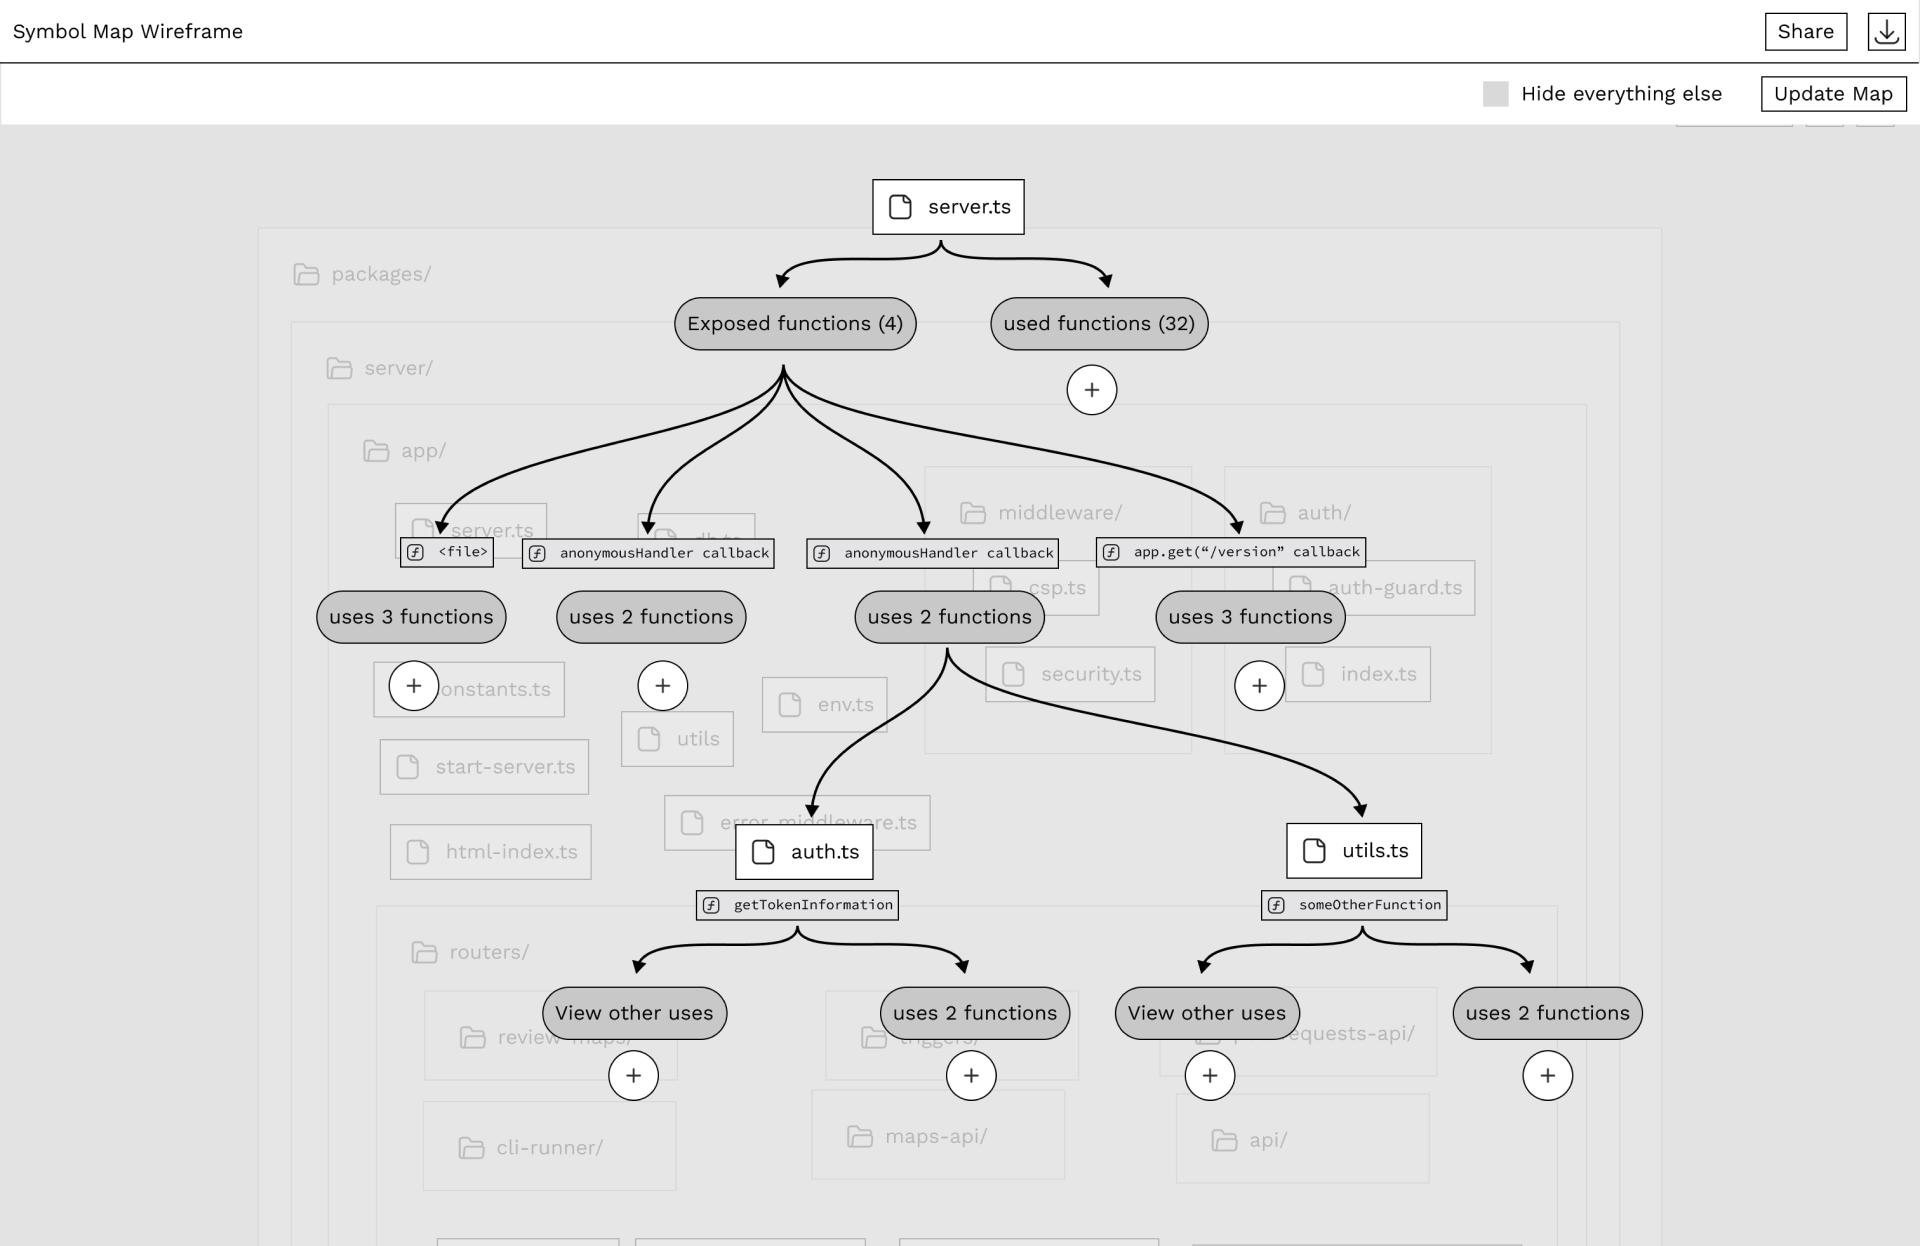
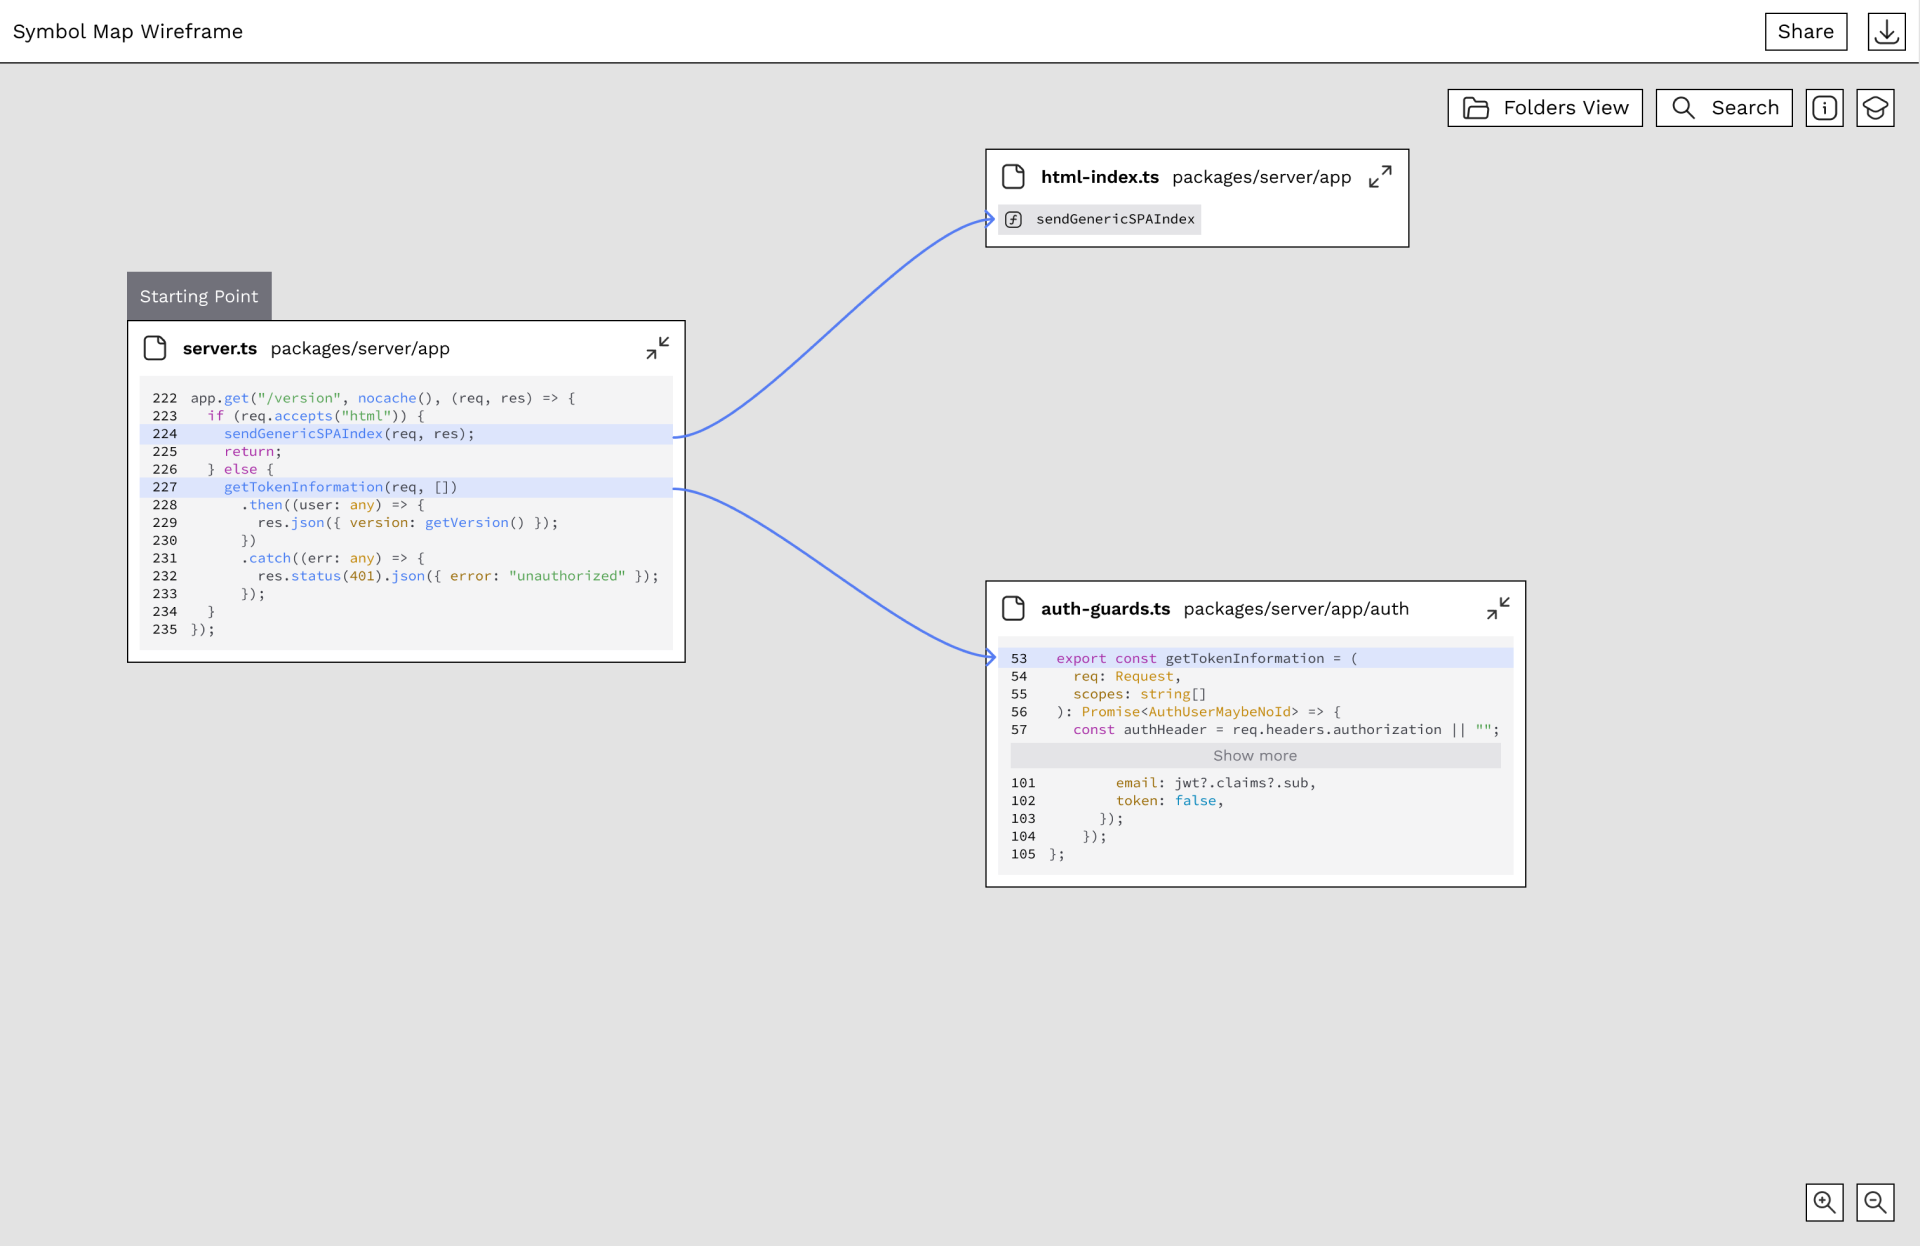
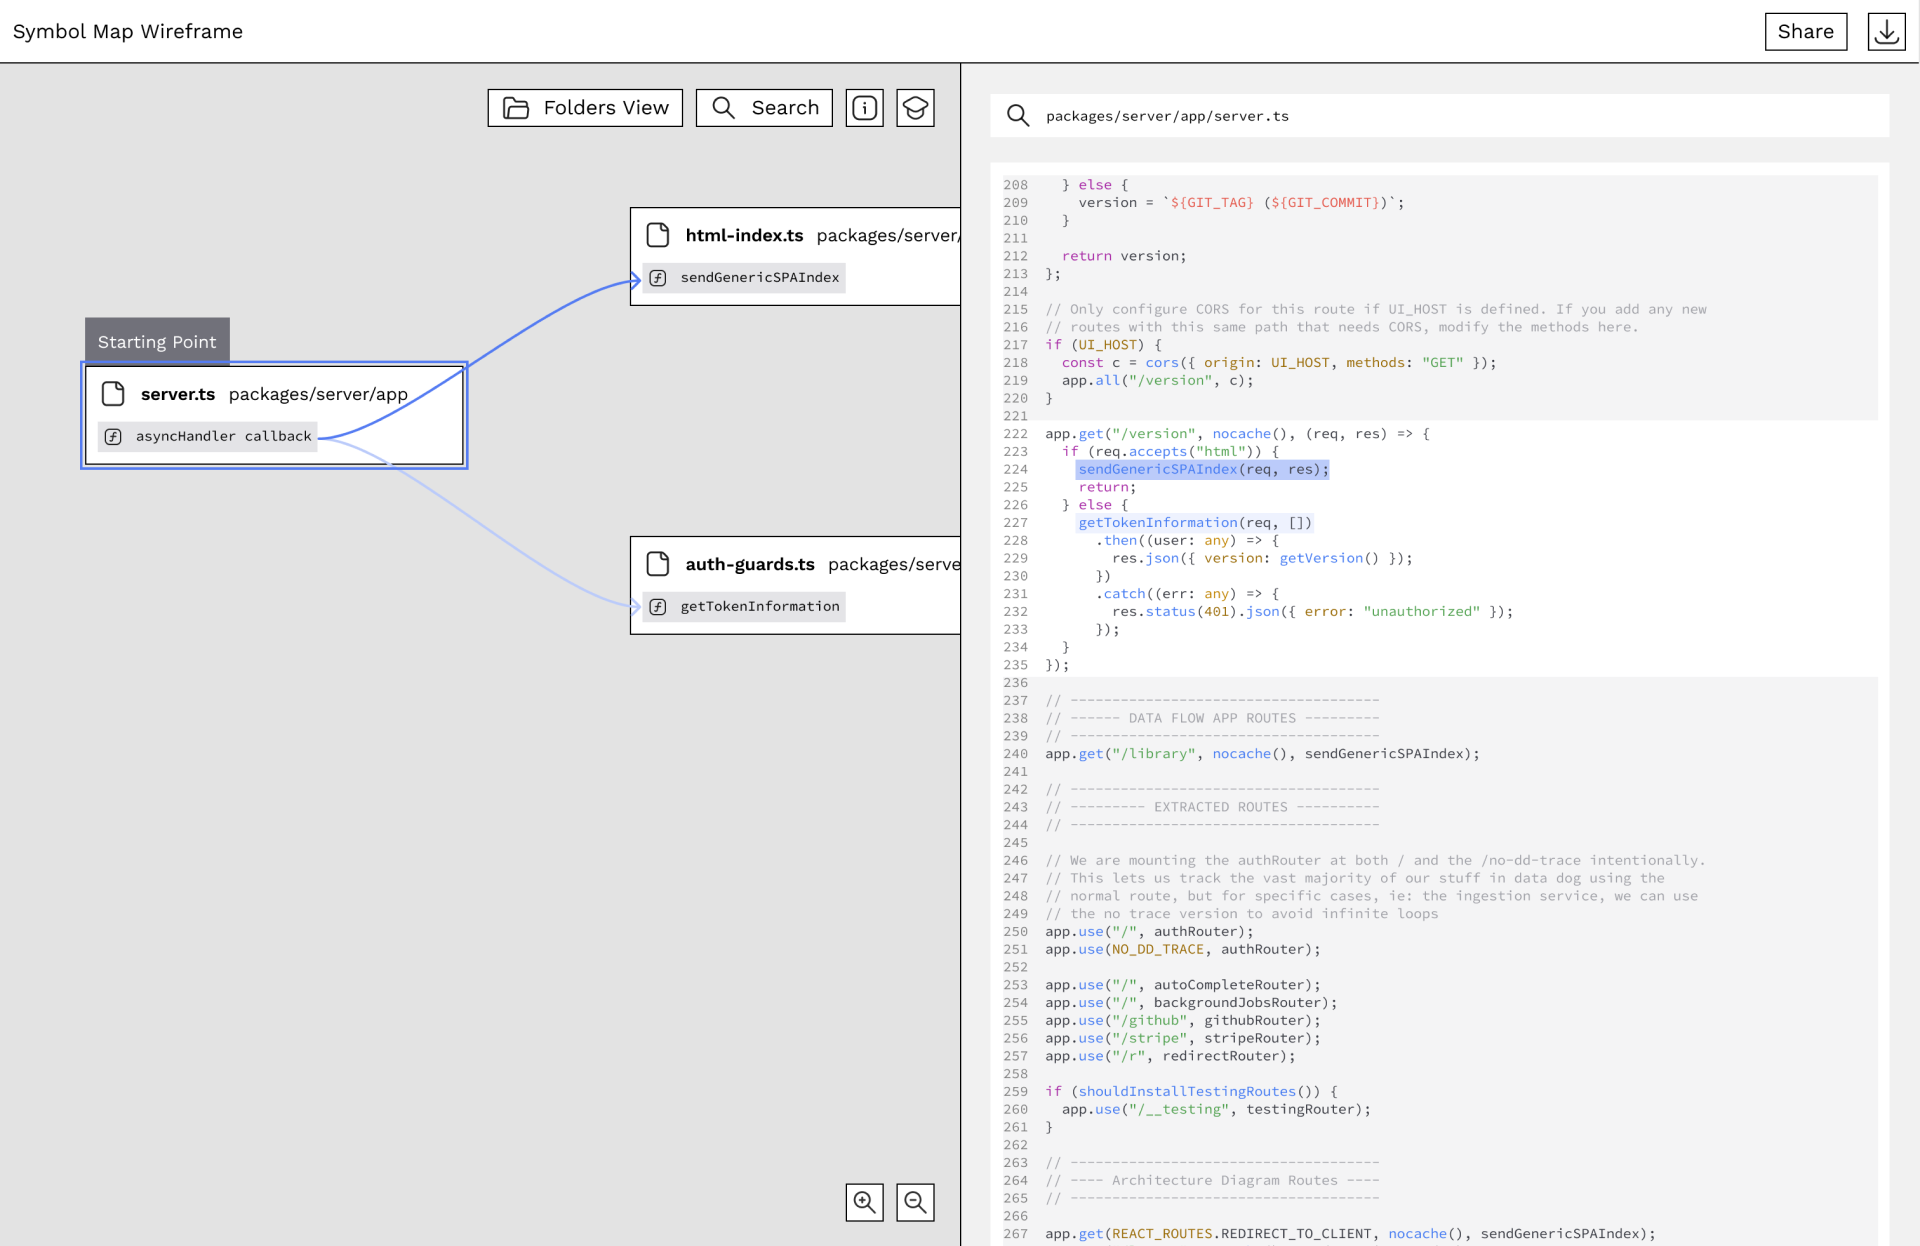
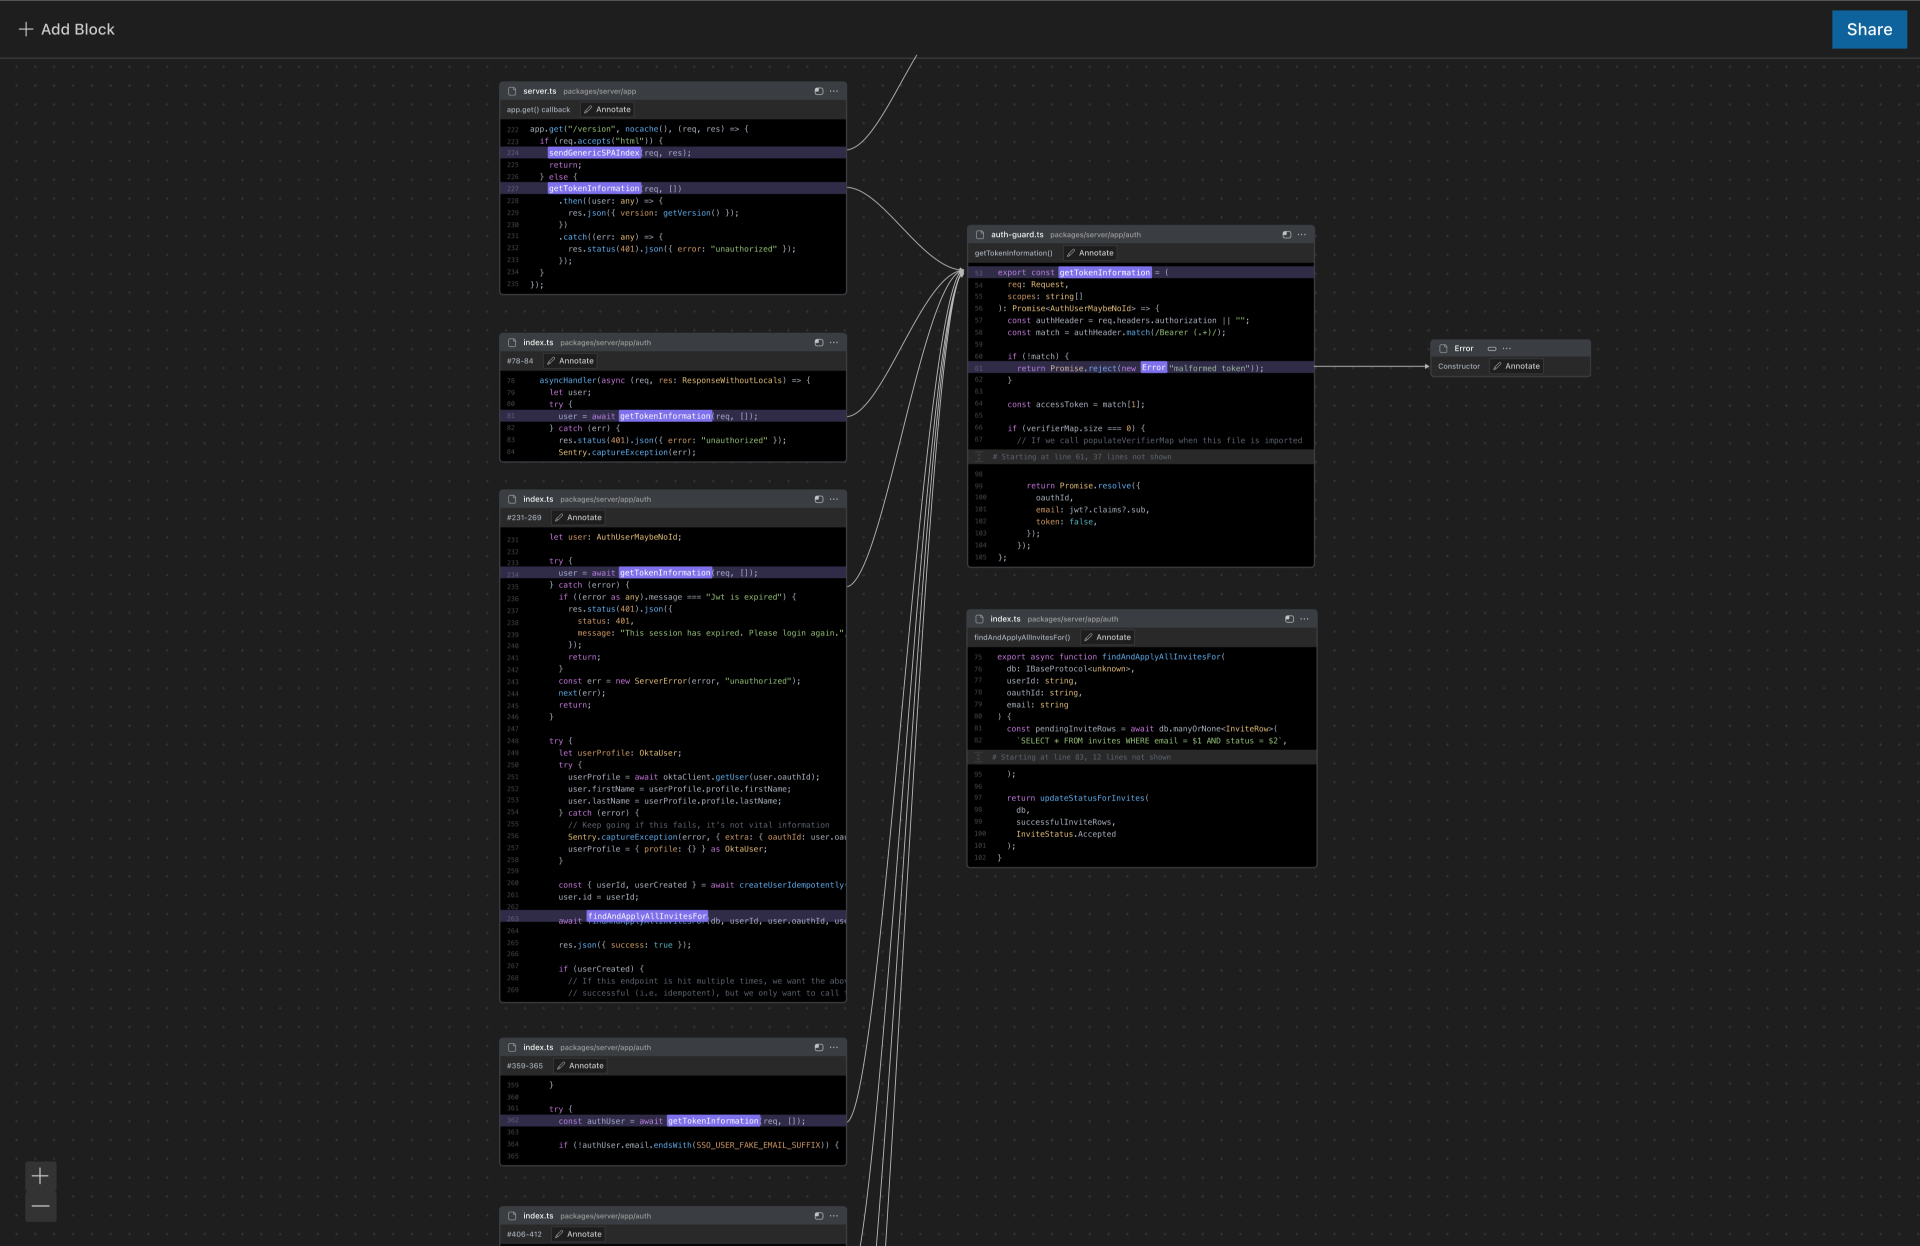
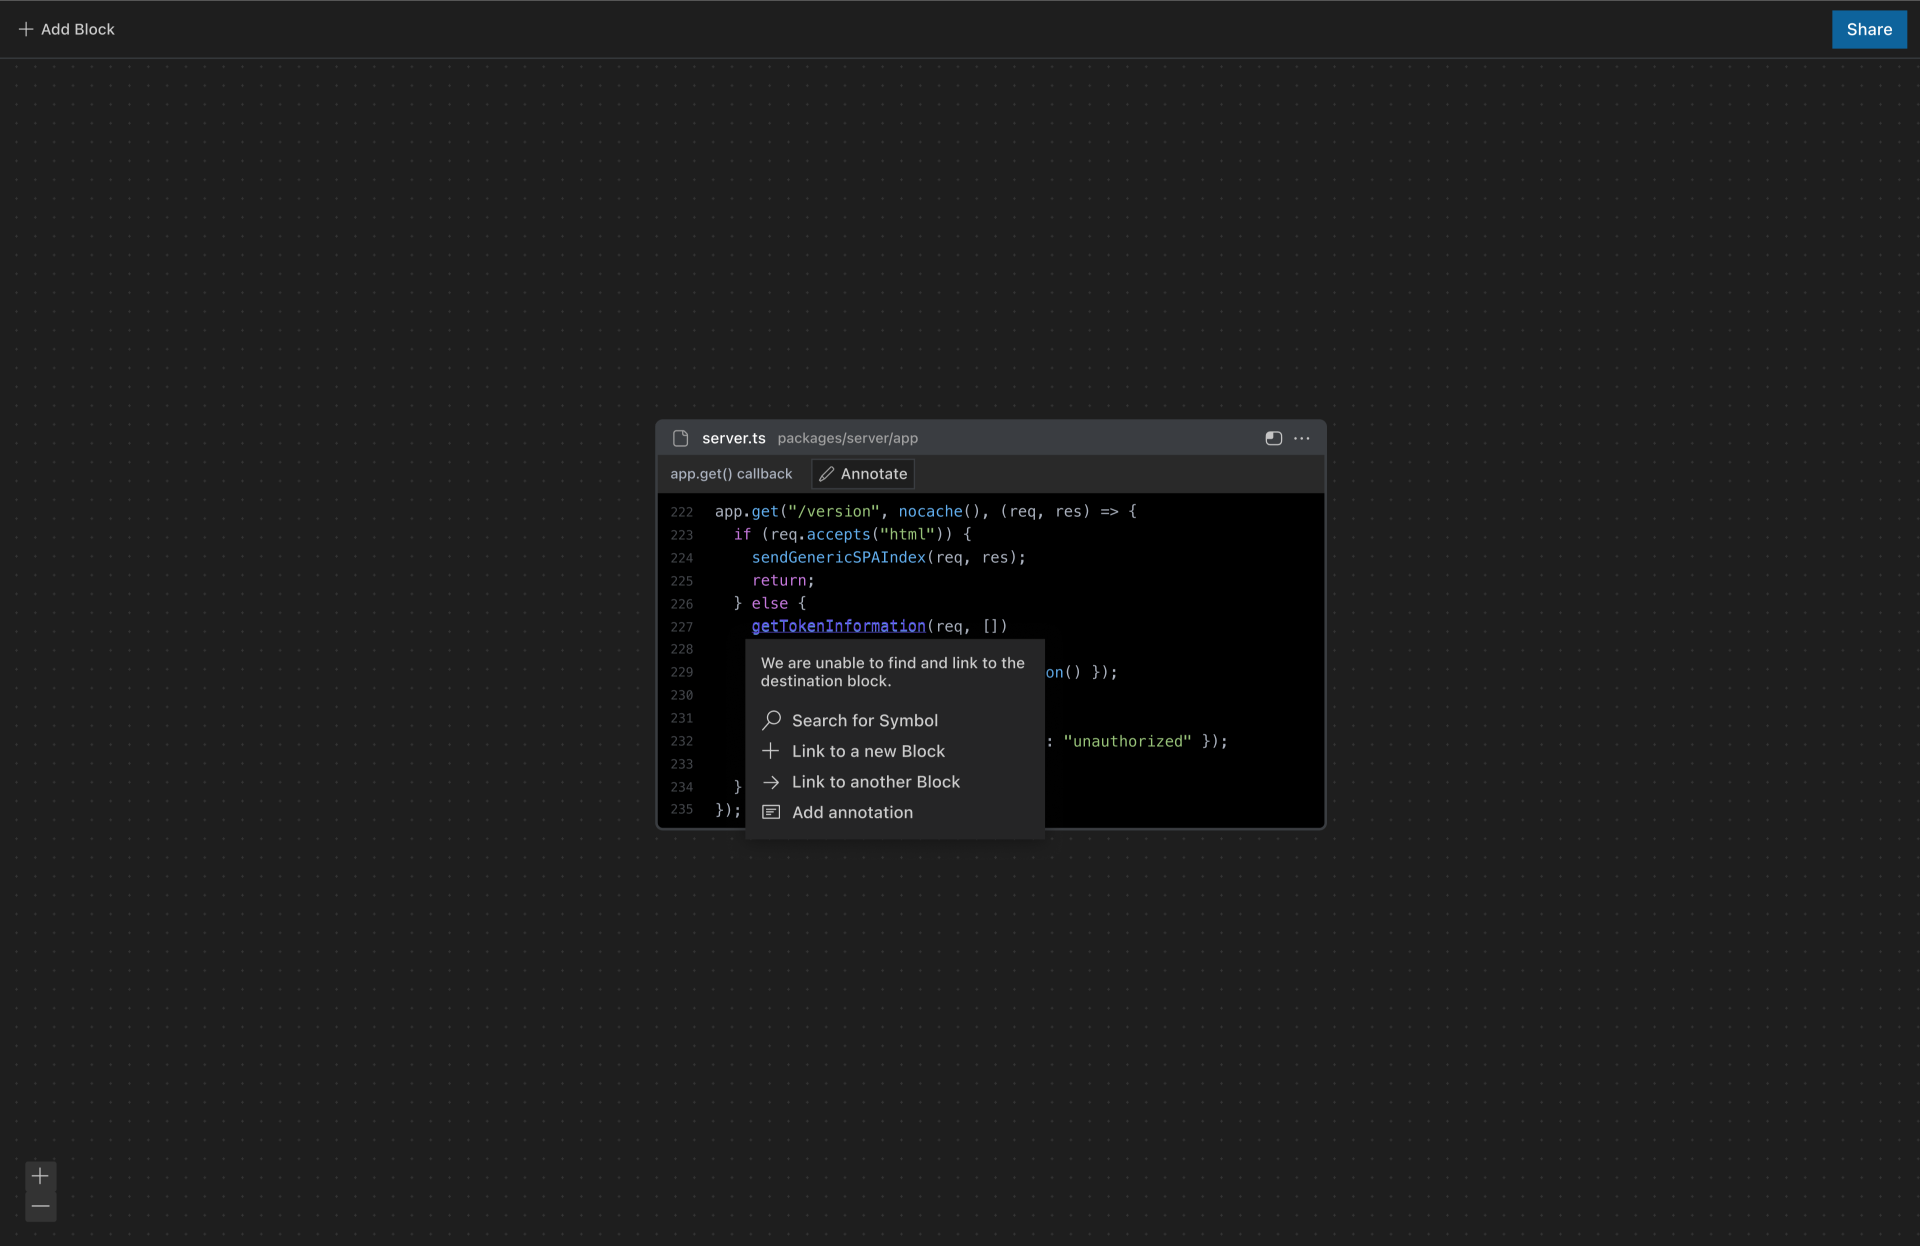
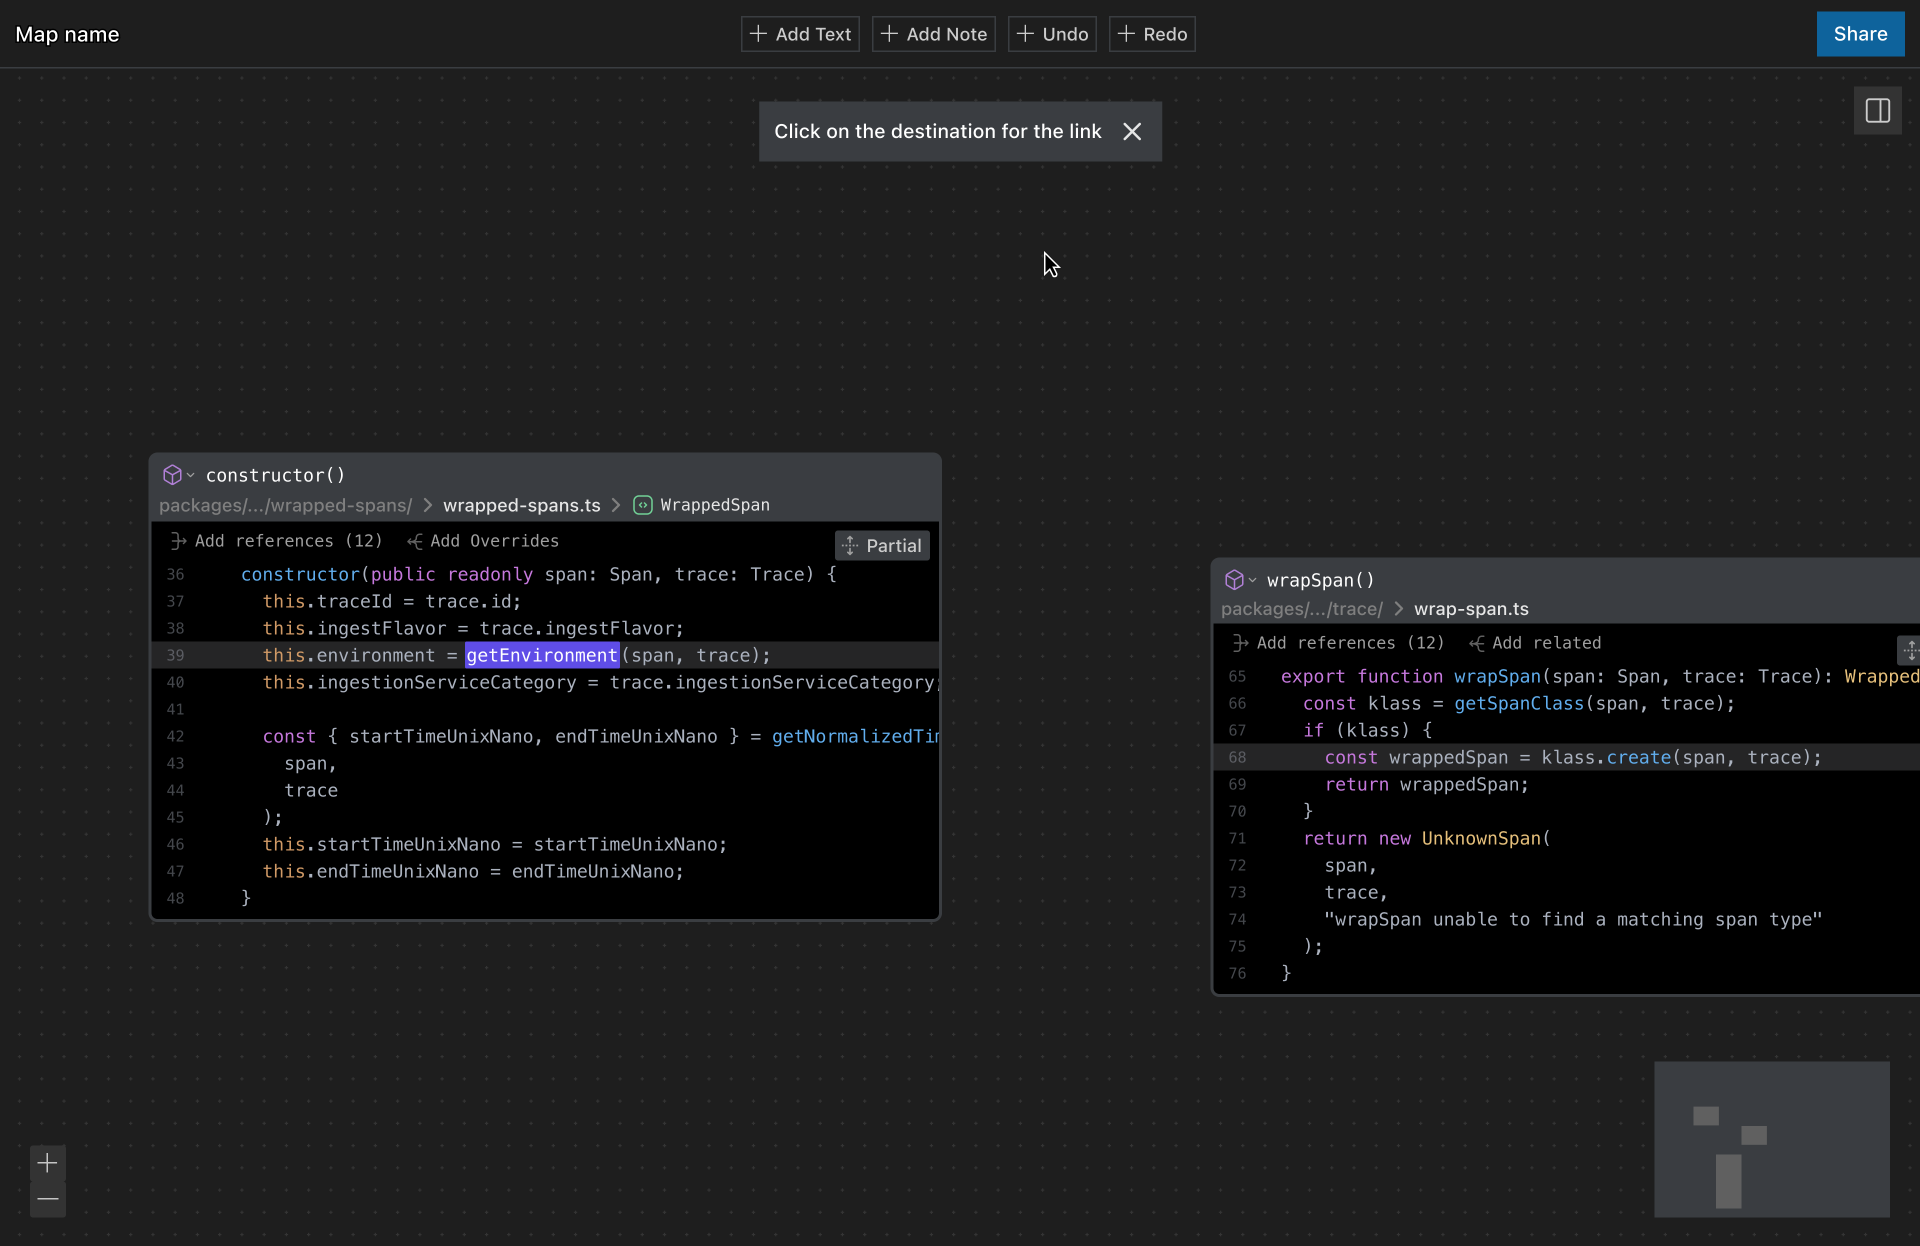
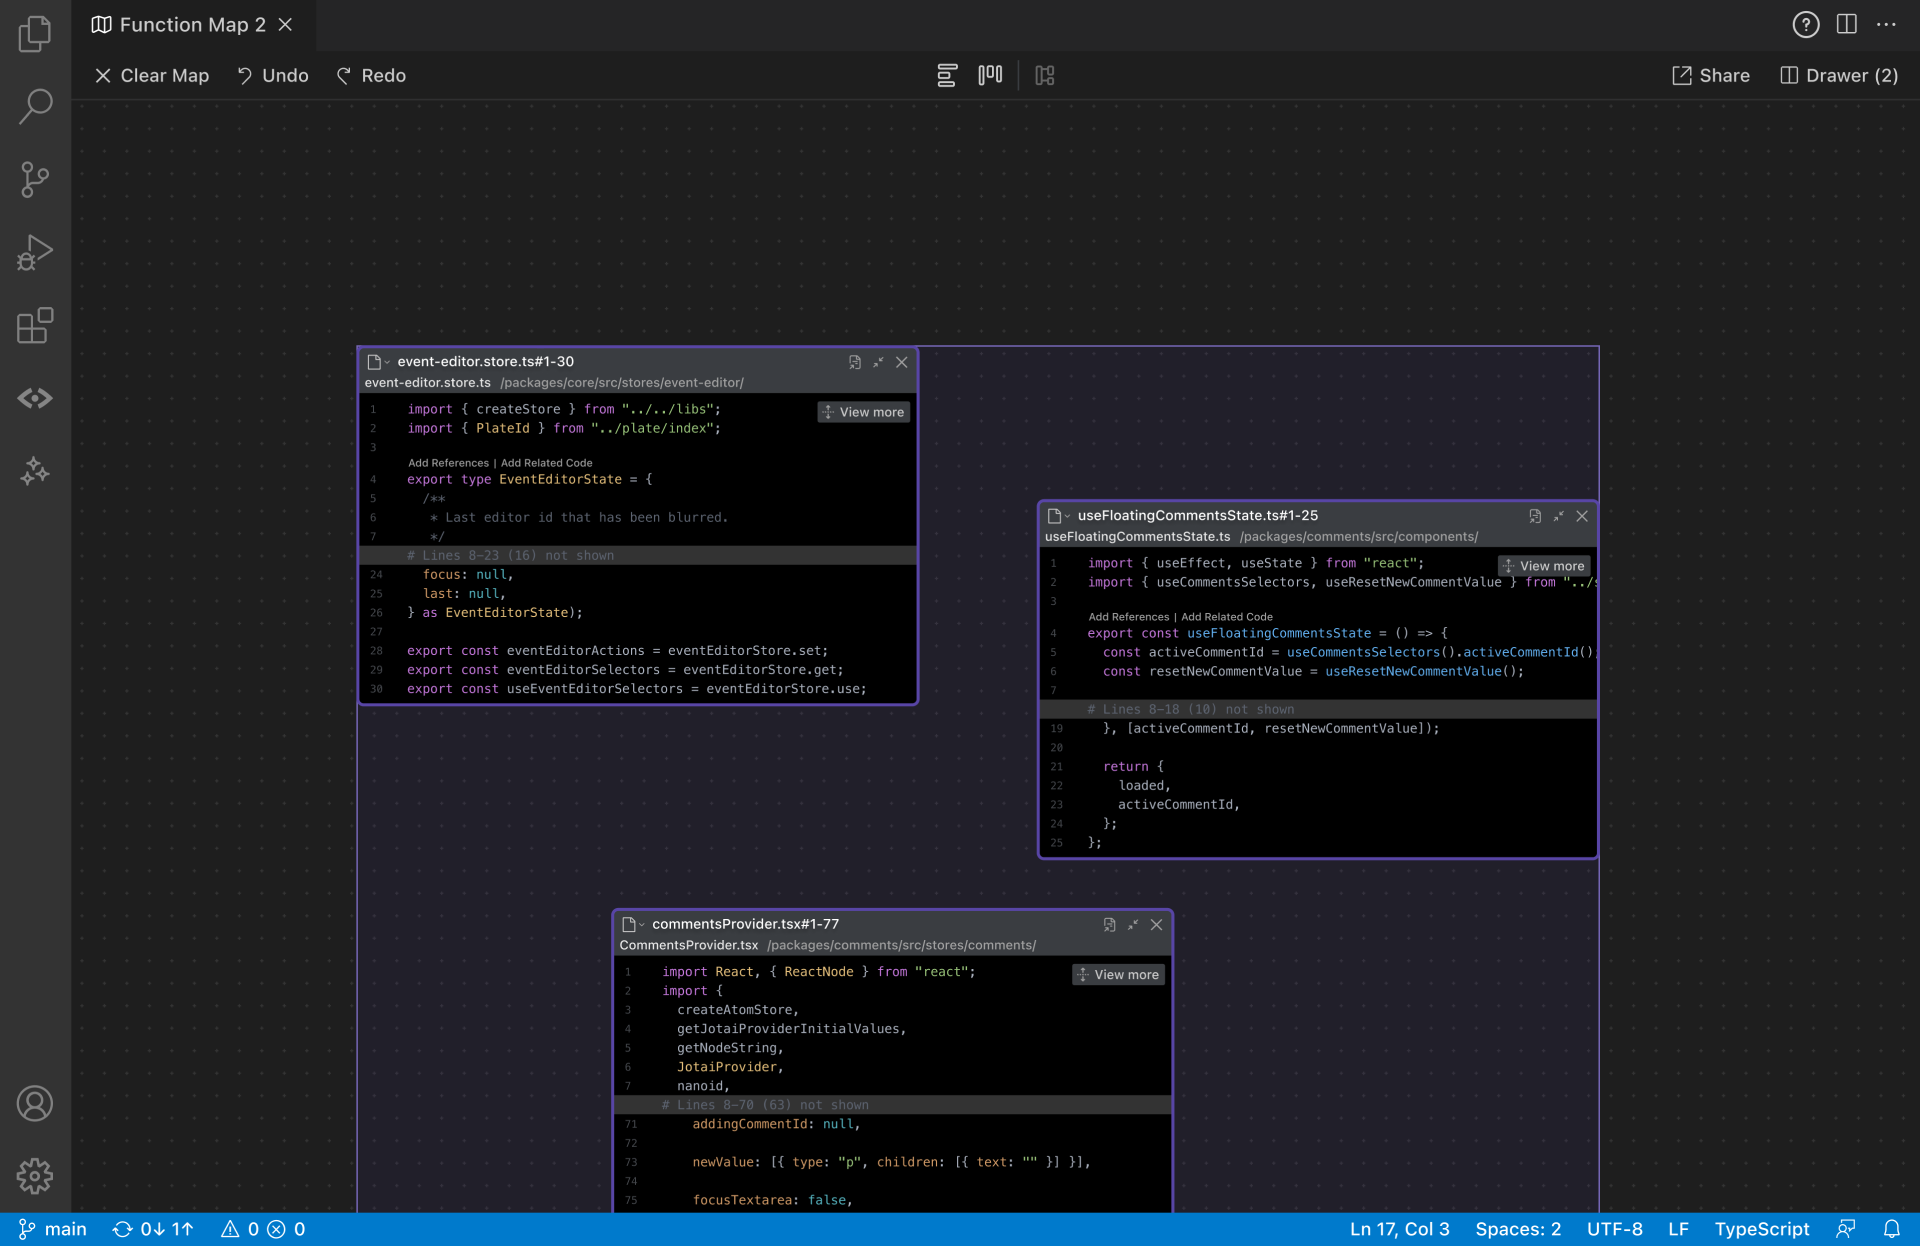
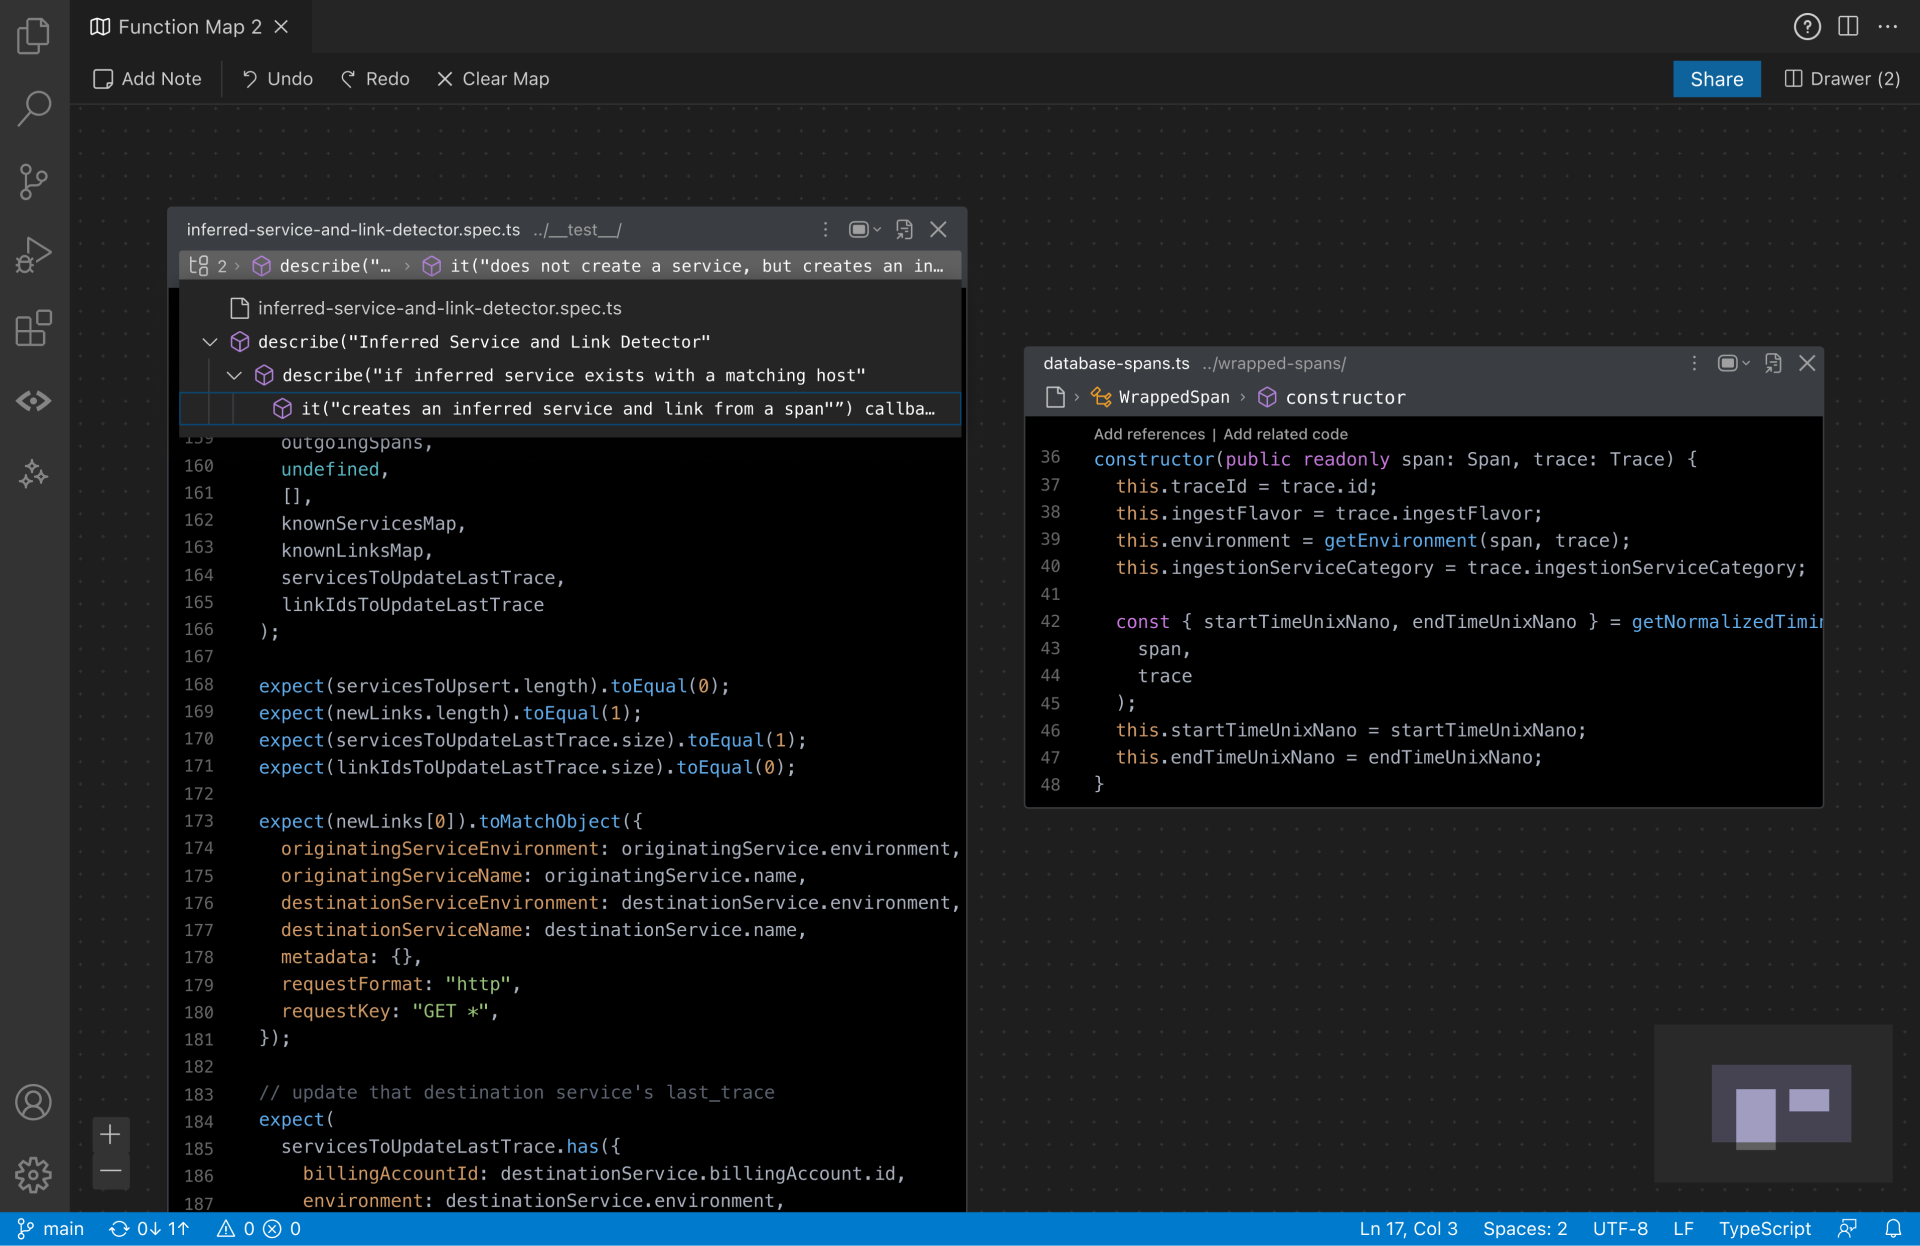
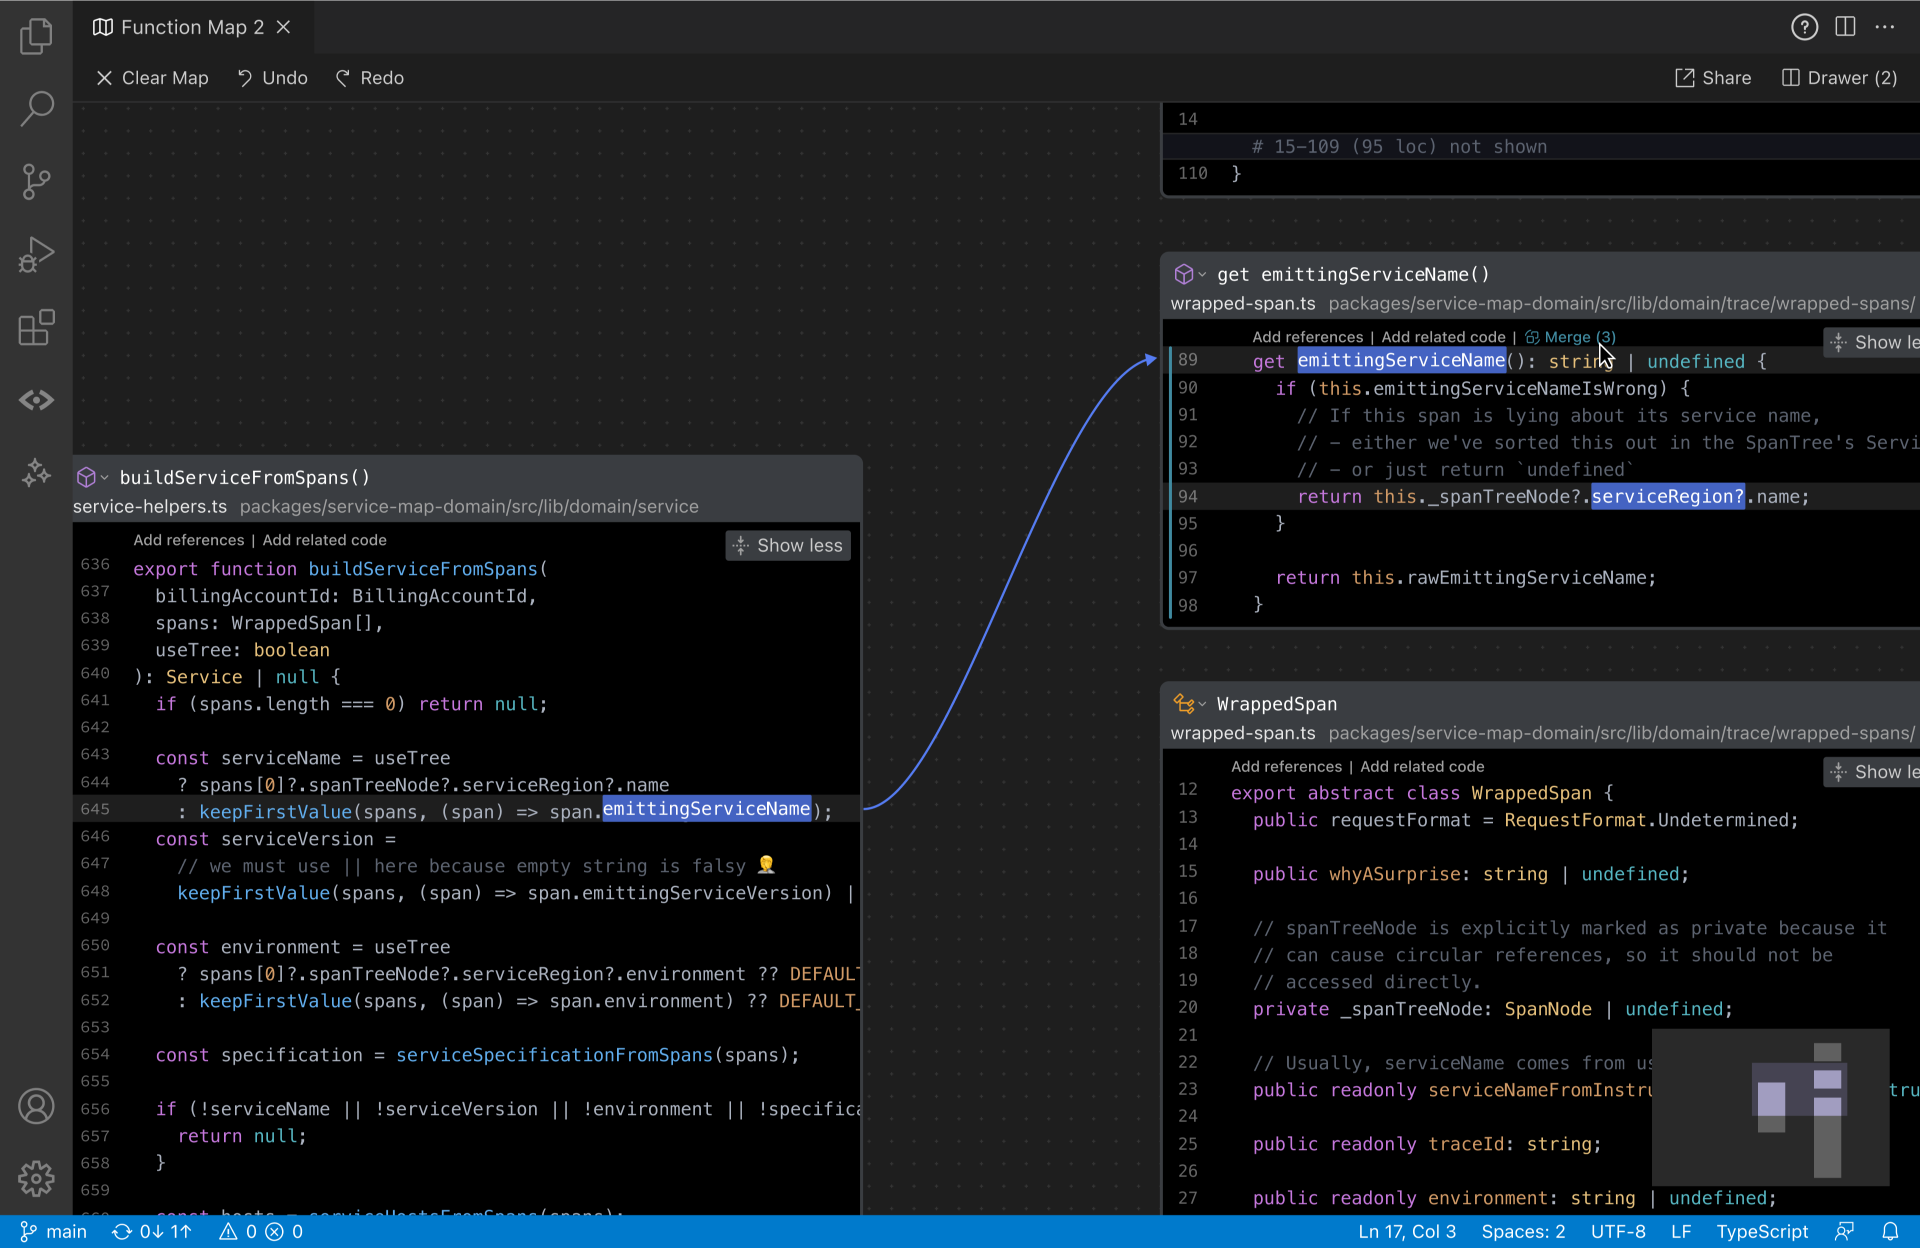
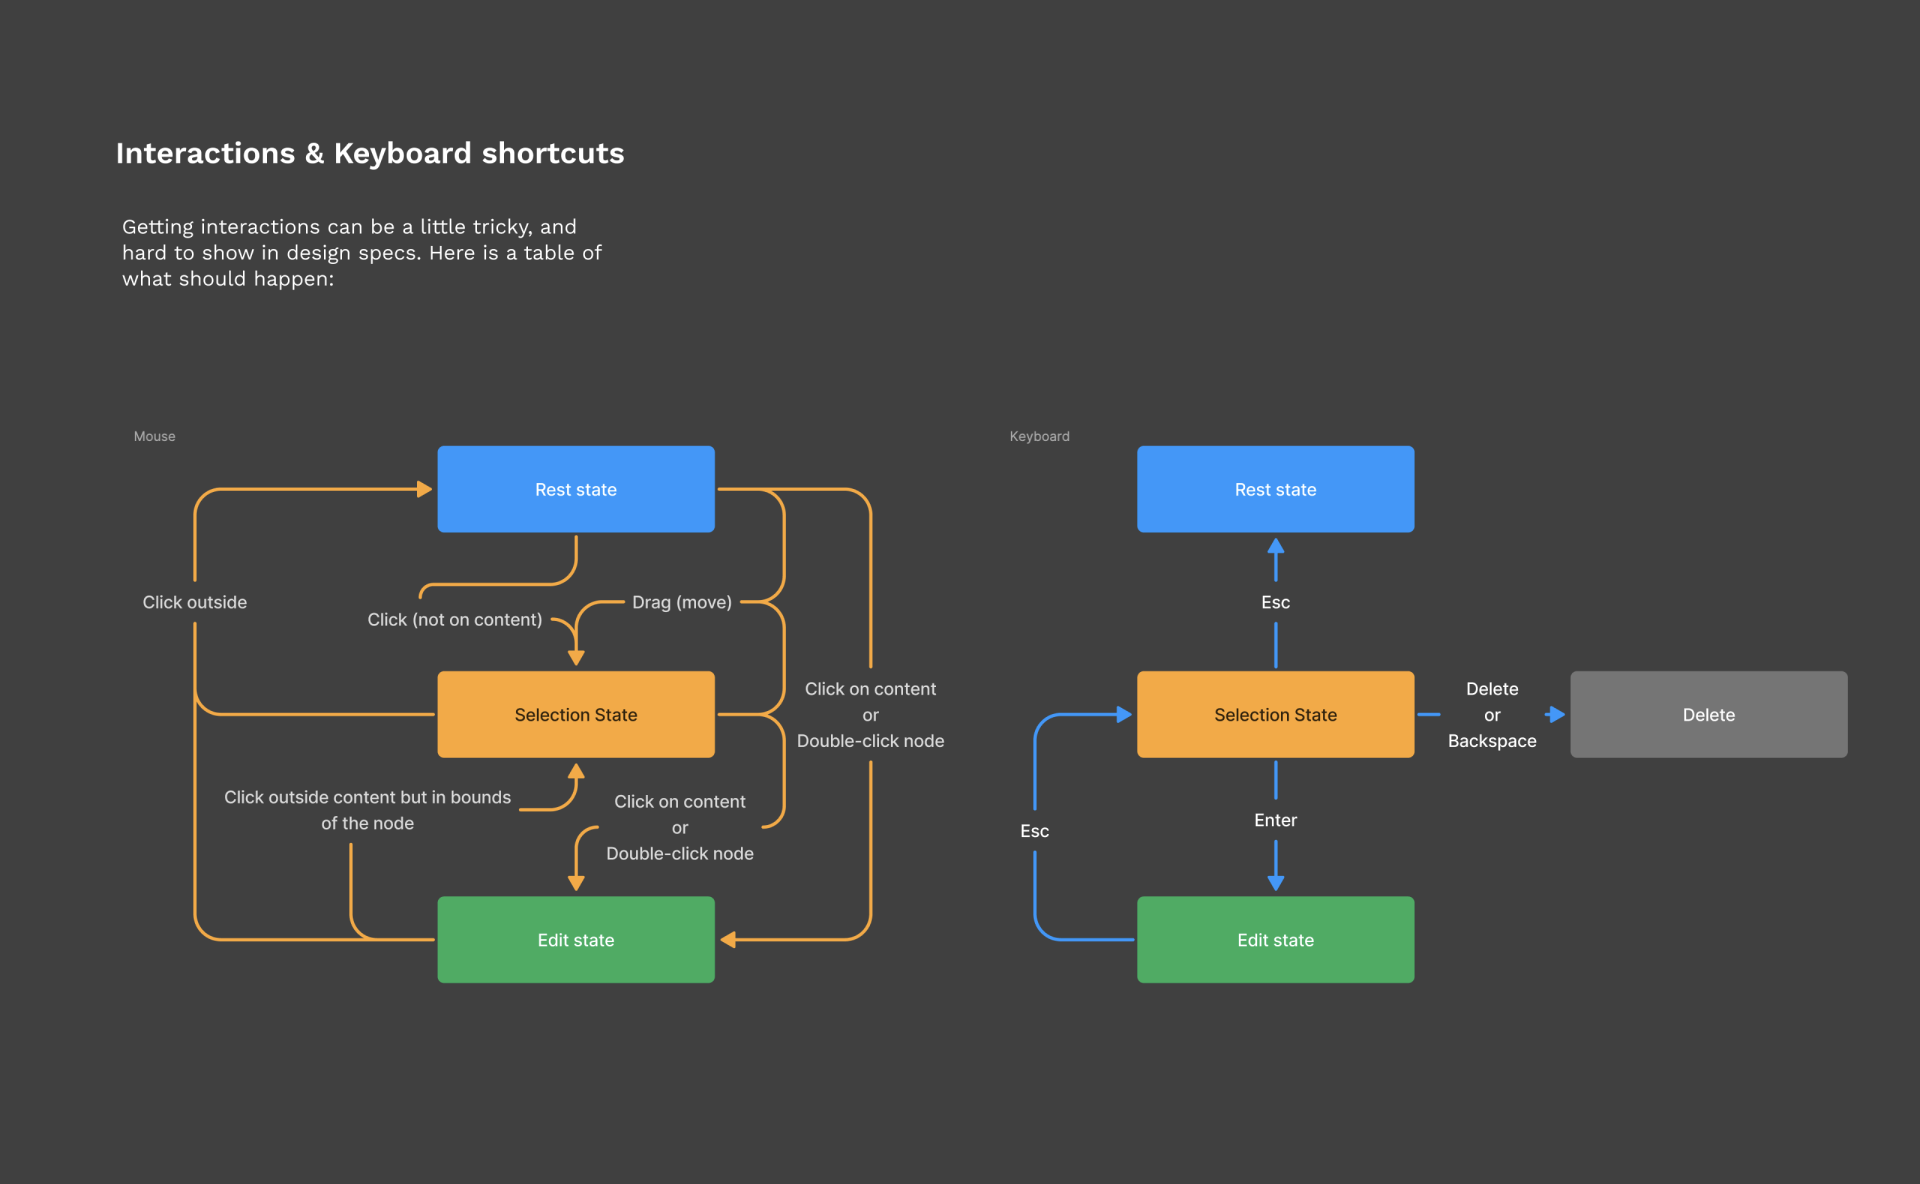
At it’s heart, Function Maps is about building a flow chart out of snippets of code inside a codebase. The core interaction starts with putting a code snippet into the map, and then clicking on symbols to reveal their implementation and follow them. Over time, this creates a tree that represents important paths that the code may take.
While the design may seem simple, it is definitely not straightforward. Even though the canvas is infinite, we are restricted by the physical screen dimensions in computers. This resulted in a lot of deliberation around the right default density of information and creating correct and useable dials for people to go in and out. In addition, because we are breaking long held expectations around files and tabs, we have to provide suitable alternatives so that people can relate what they are looking at to the environment that they eventually need to work in.
Beyond function calls
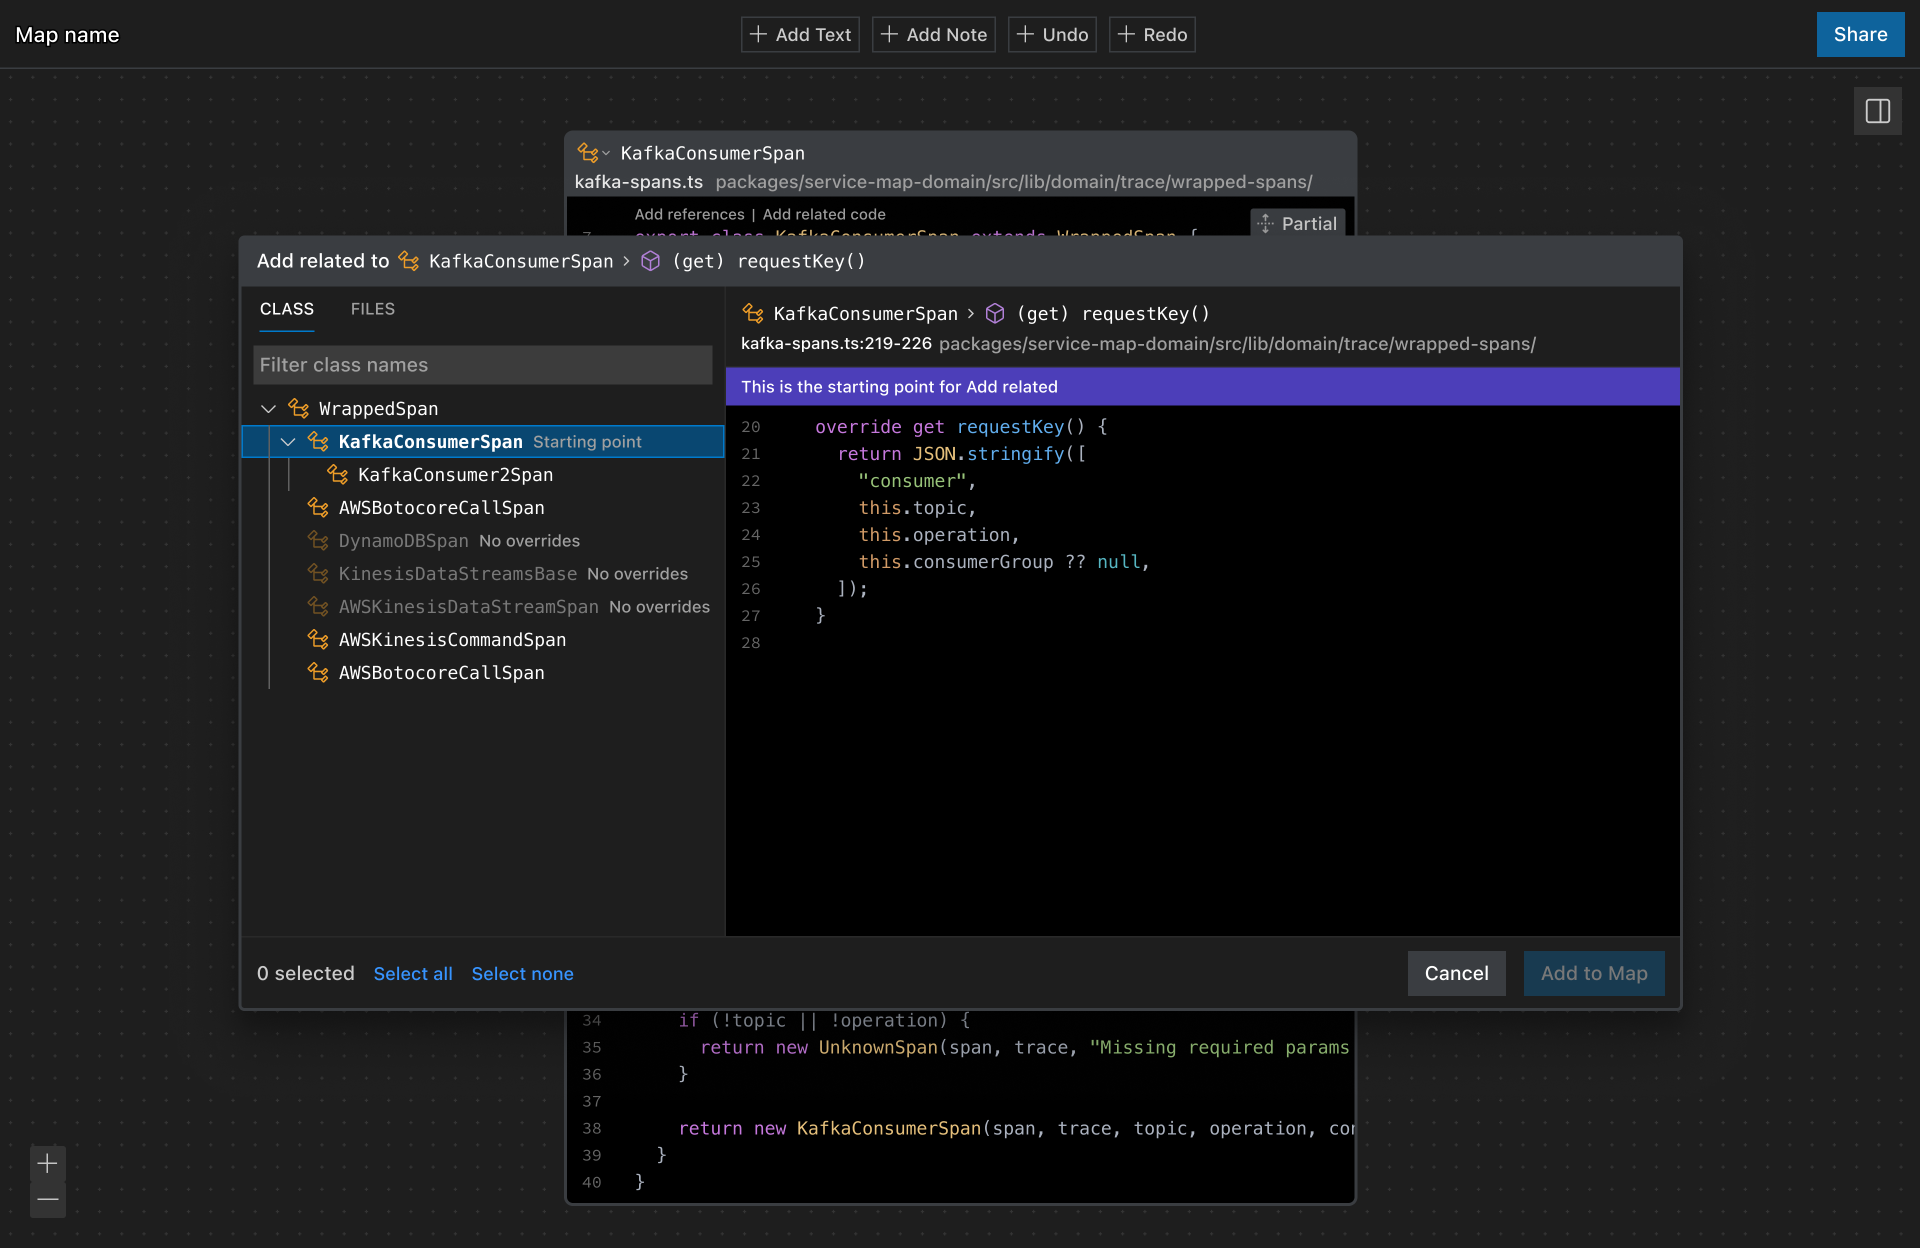
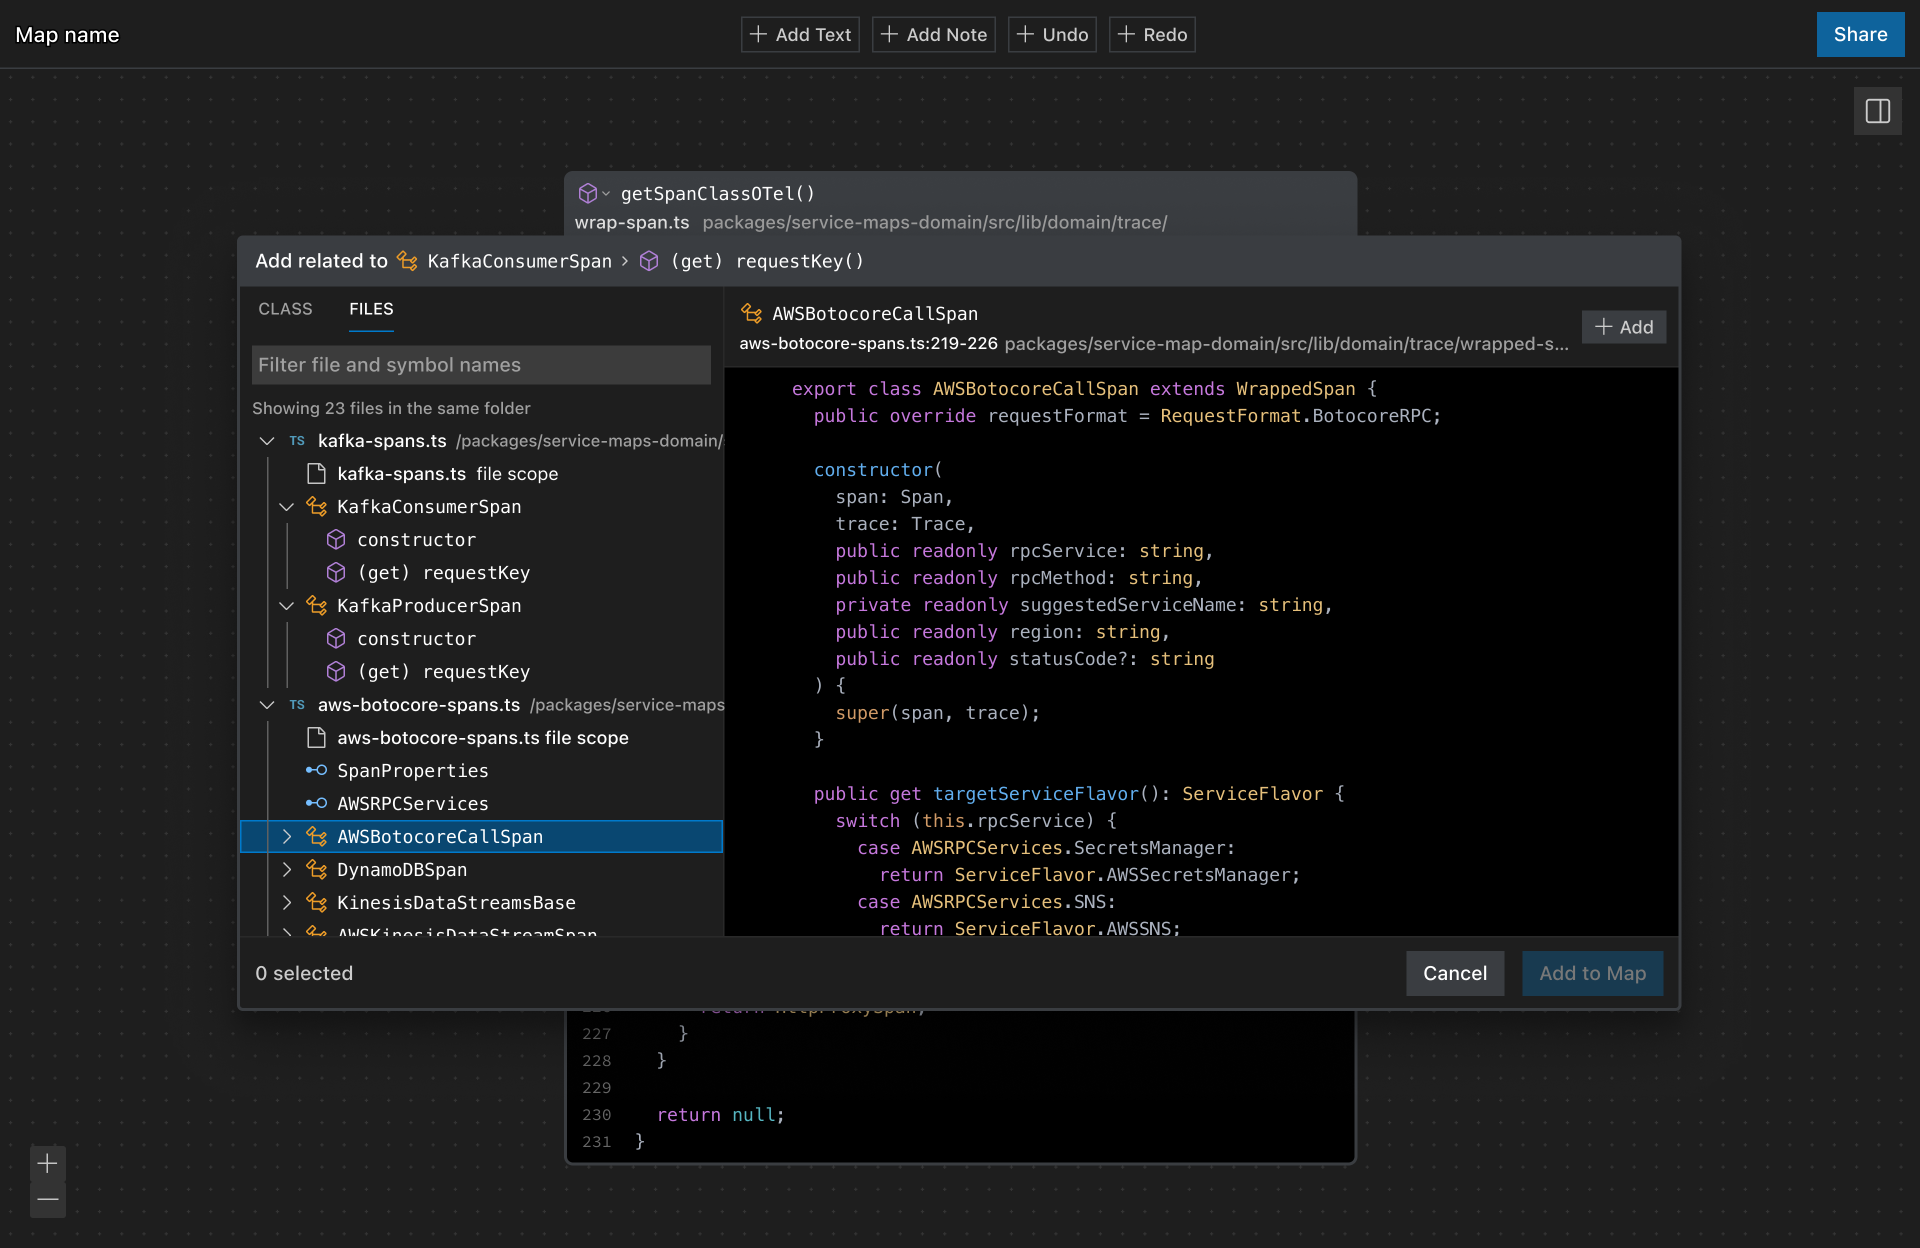
The first diversion from the initial plan was to consider how to visualize object relationships on top of function calls. While following function calls is broadly useful, this may not be the best way of looking at a codebase. For object-oriented languages, resolving the full code path often involves traversing up complex inheritance chains.
To represent the fullness of the code paths, we had to rethink the way nodes relate to each other on the map. The result is a map that went beyond function calls. Users can now inspect any class or class method and find a list of code nodes that it may be related to, and add that to the map. This is especially helpful for coding patterns that rely on code reuse.
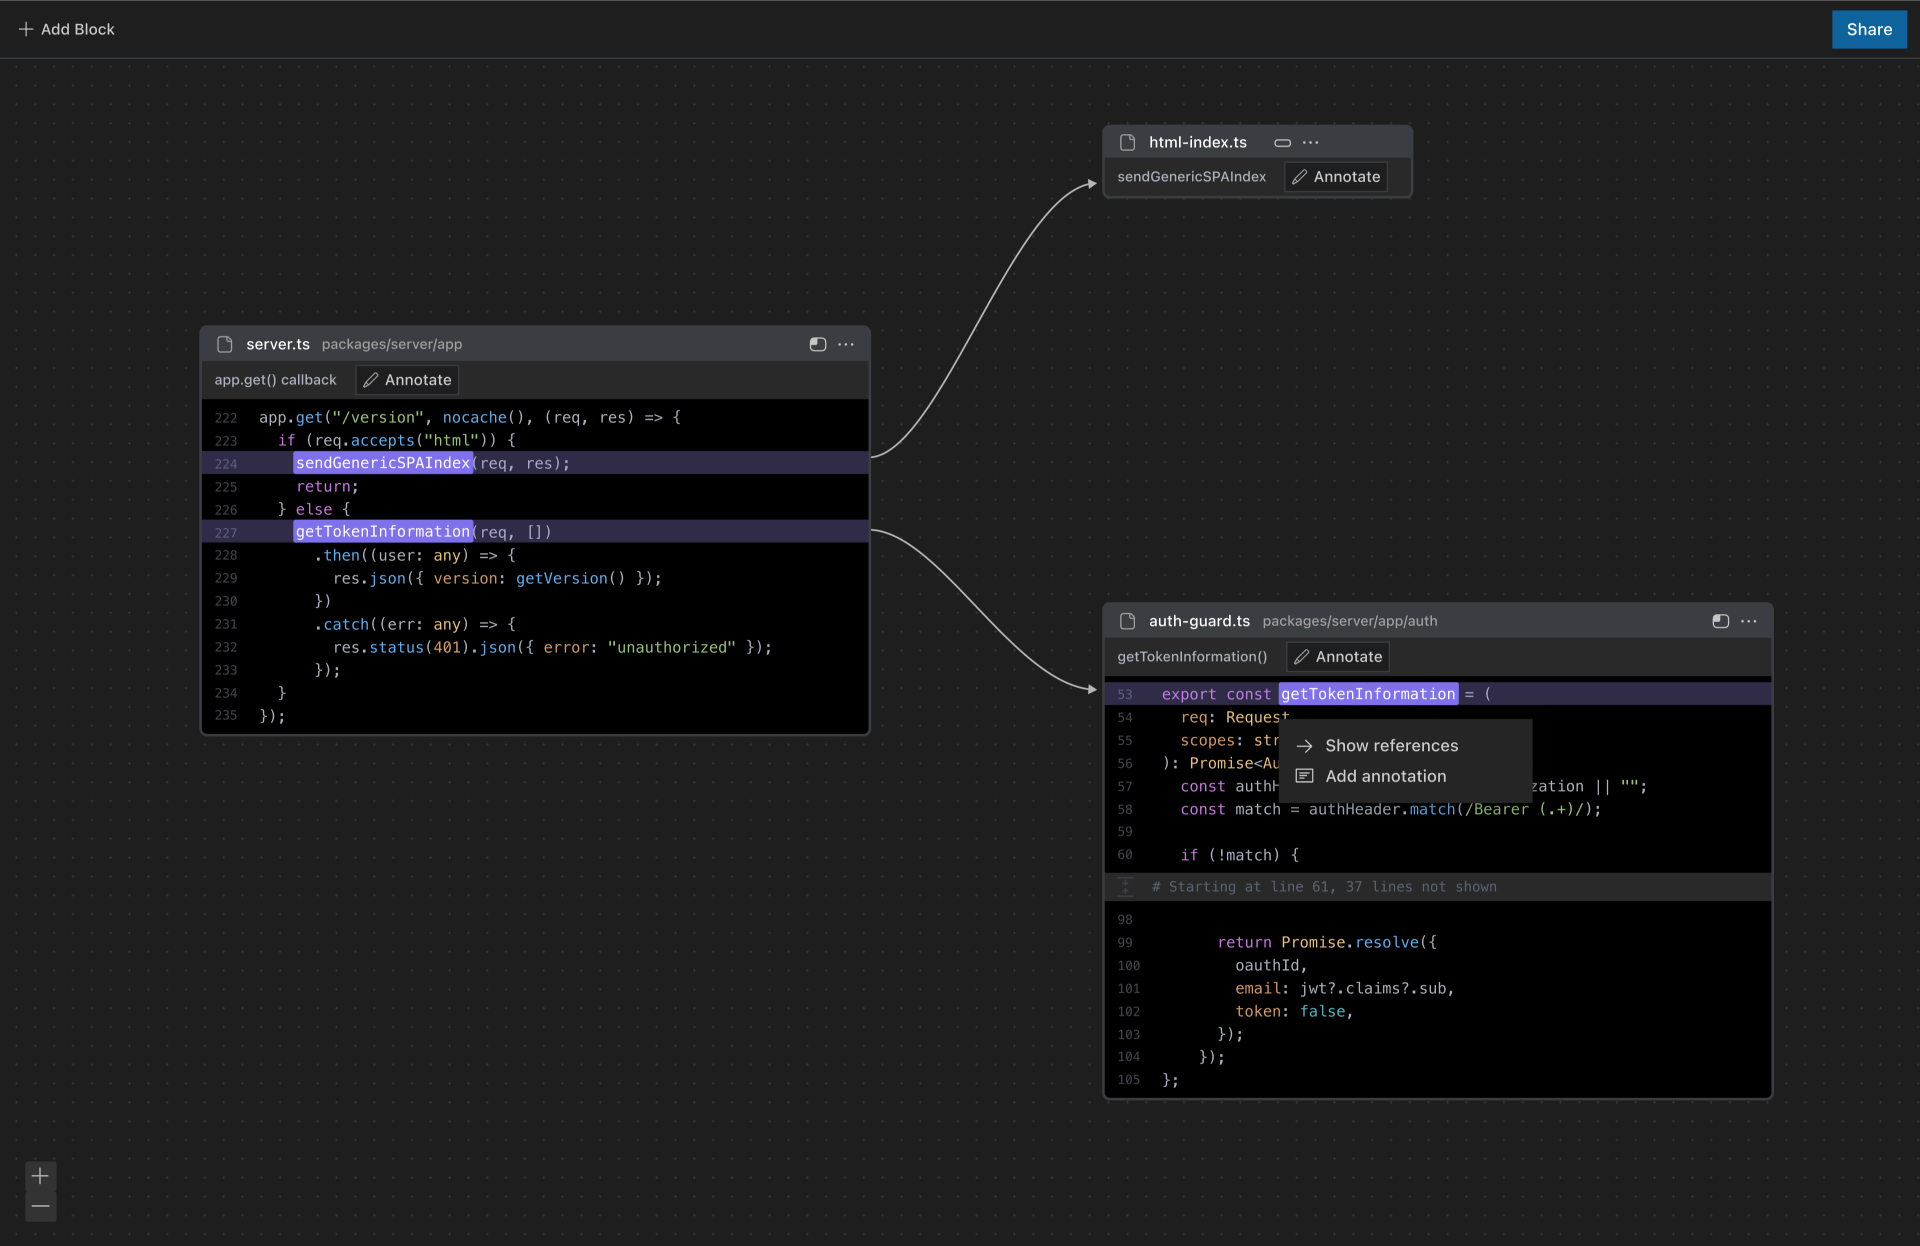
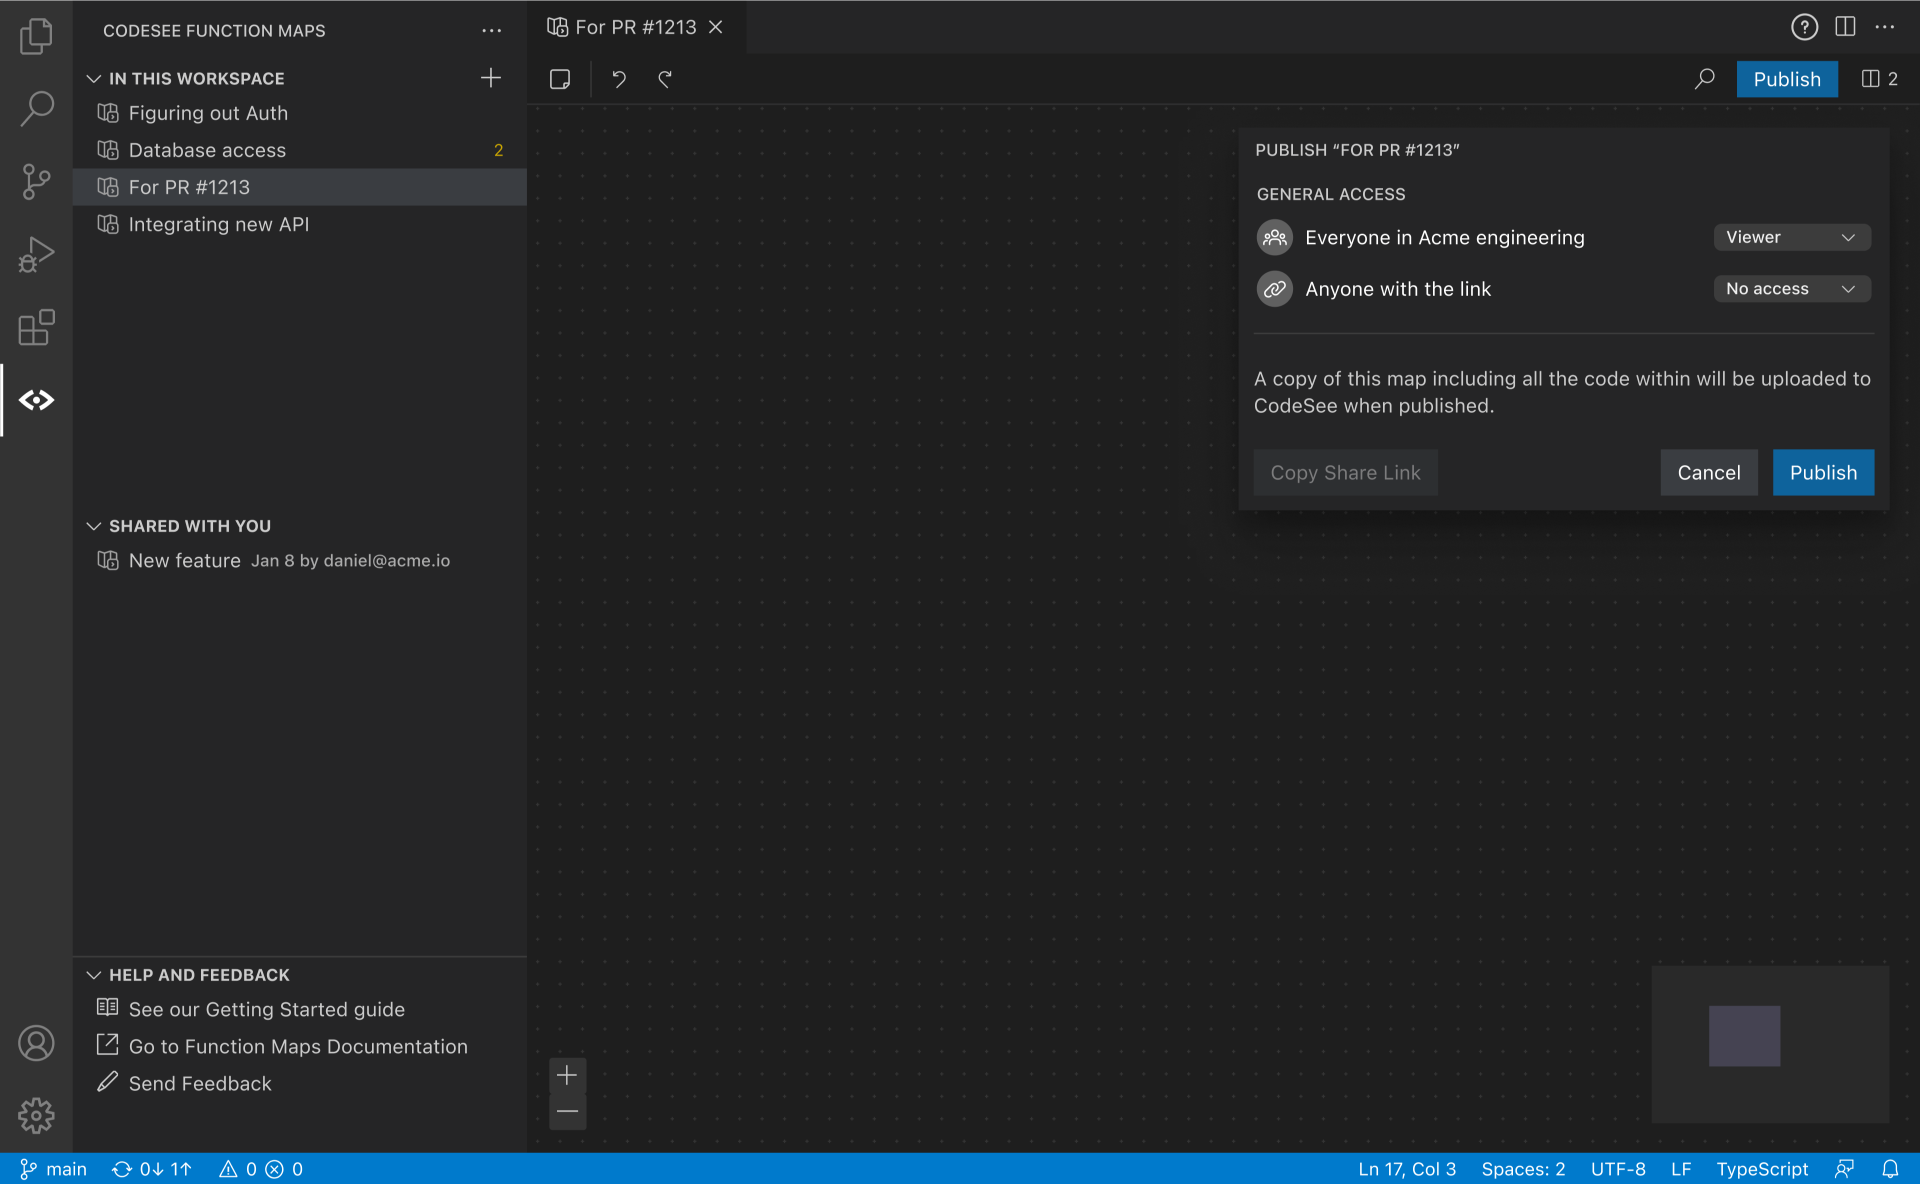
Annotations and sharing
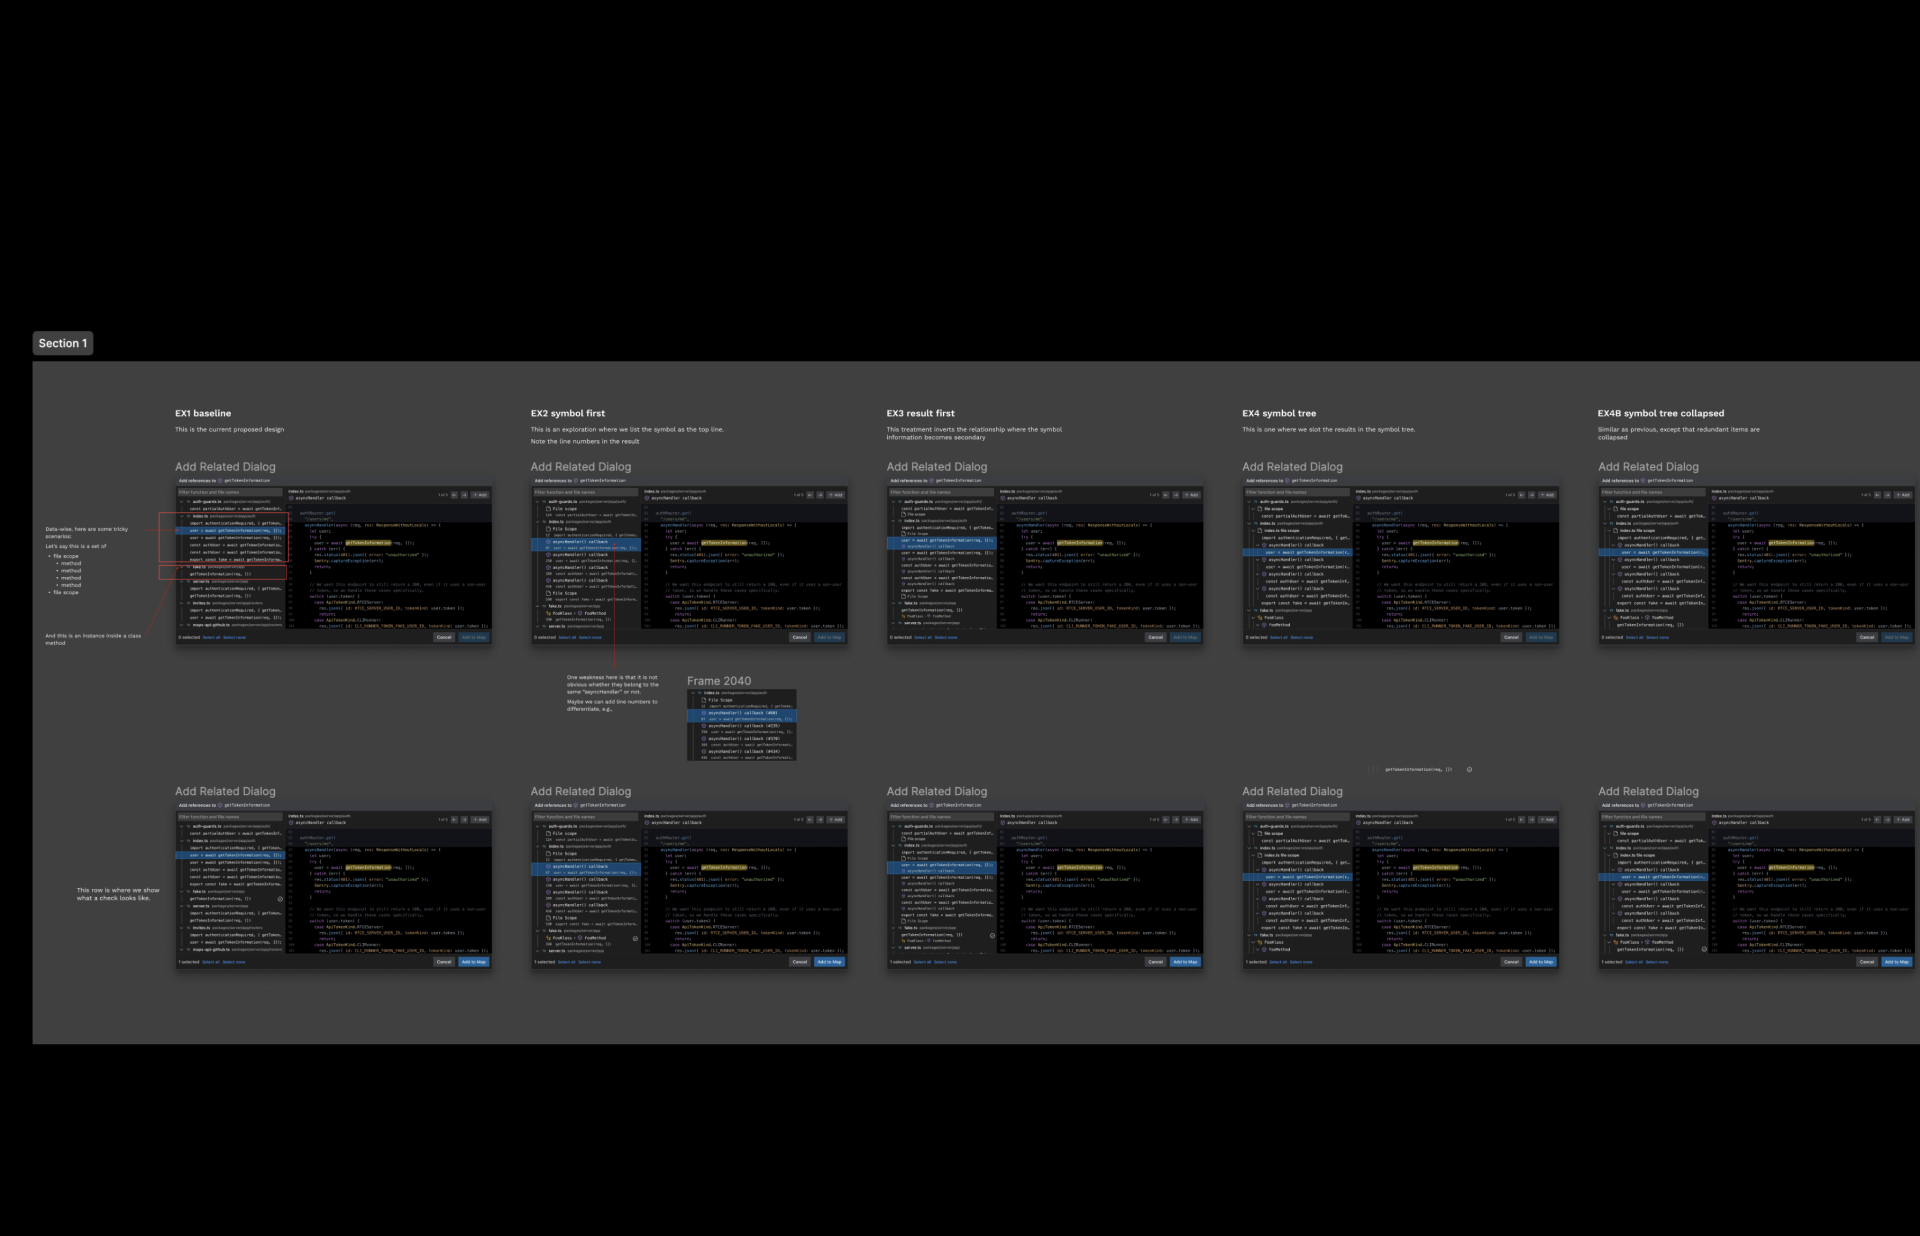
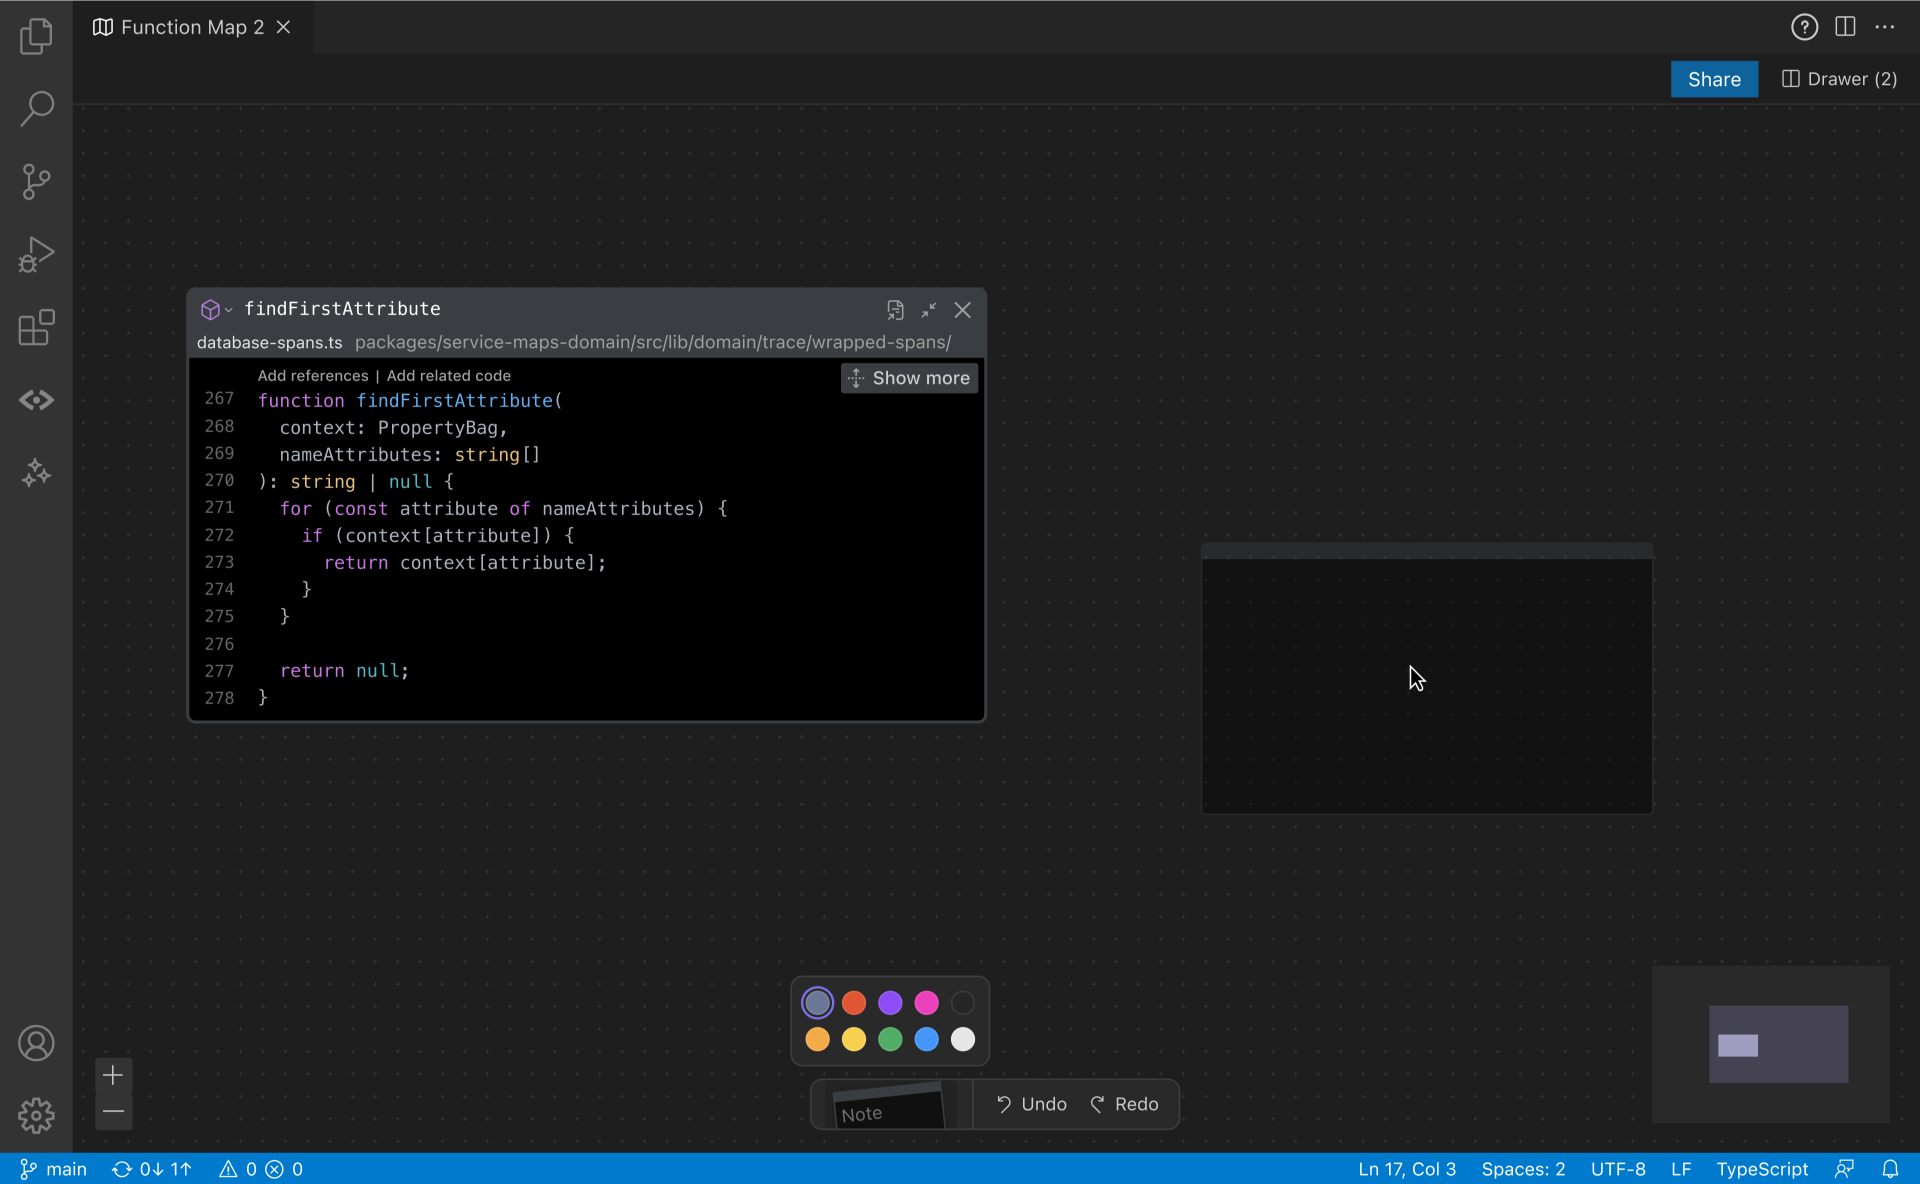
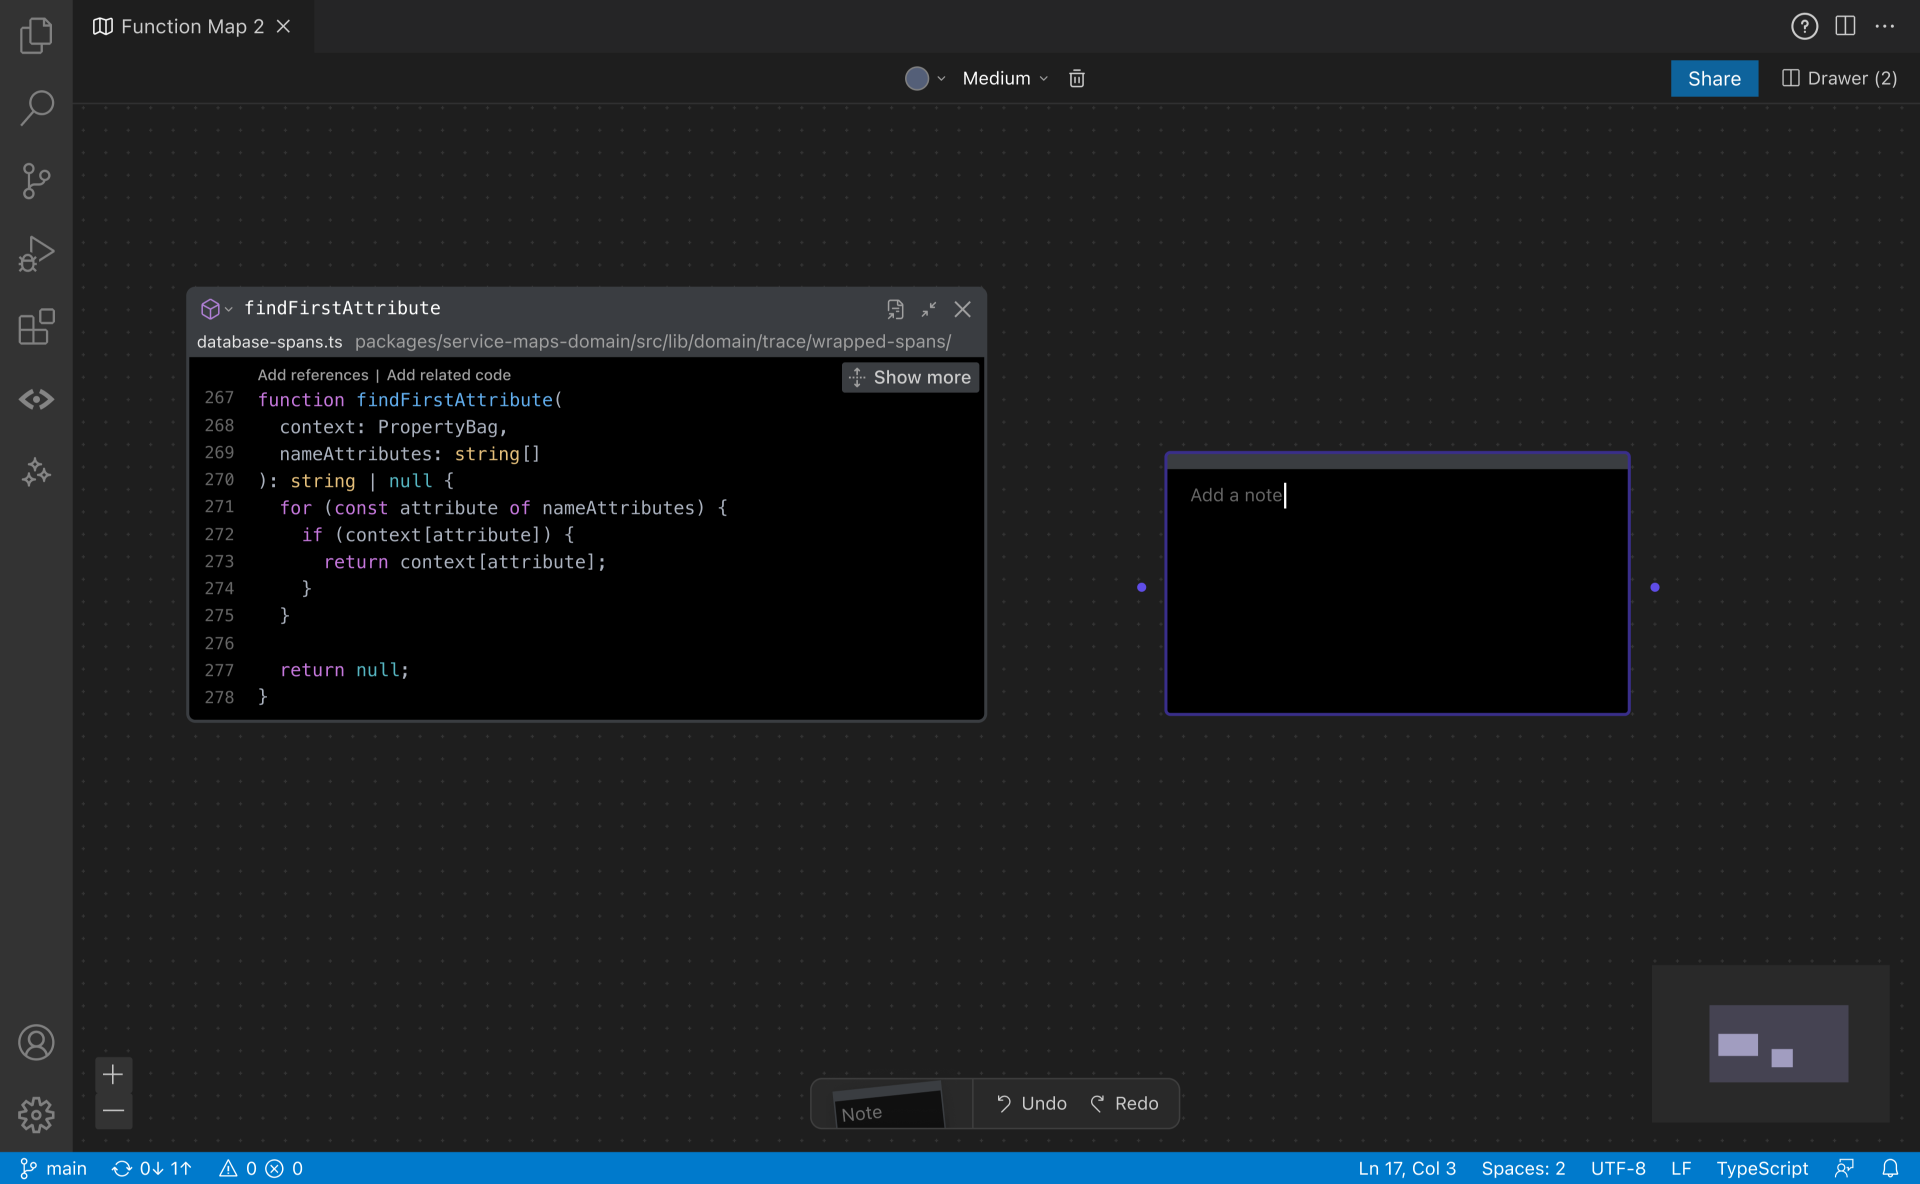
While the visualization helps with learning or expressing source code, it is only half of the problem. Since most users work in teams, the next most useful thing for them to do is to add annotations to the map and then share the map on a communication tool or documentation site. Here are a series of designs for that.
Release
Function Maps launched on the Visual Studio Code marketplace on October 2023. It has a one week free trial and was available only to CodeSee Enterprise customers.
Here is a video walkthrough of some of the features in the latest version.
Reception and aftermath
Function Maps quickly became the main selling point of the CodeSee suite. Prospects were most interested in Function Maps and wanted to see how it would perform in their codebase, language, and framework. A lot of immediate engineering work was to diversify the language support. People started asking for Function Maps in platforms other than VS Code. .
Here are a collection of positive reviews:
[…] the thing itself is almost perfect. It amazes me that this is not a standard feature of vs code, saves so much head space!
This tool is a game-changer. Nothing less. […]
In February 2024, CodeSee was acquired by GitKraken for their new DevEx platform.
-
In Codebase Maps, source code was visualized at the granularity of files and folders. ↩